 3
3peptides
spectra
0.804 | 0.888
0.000 | 0.031
0.000 | 0.079
0.000 | 0.050
0.000 | 0.000
0.014 | 0.154
0.000 | 0.000
0.000 | 0.000
| Plot | Mito | Lyso | Perox | ER | Golgi | PM | Cytosol | Nucleus | |||||
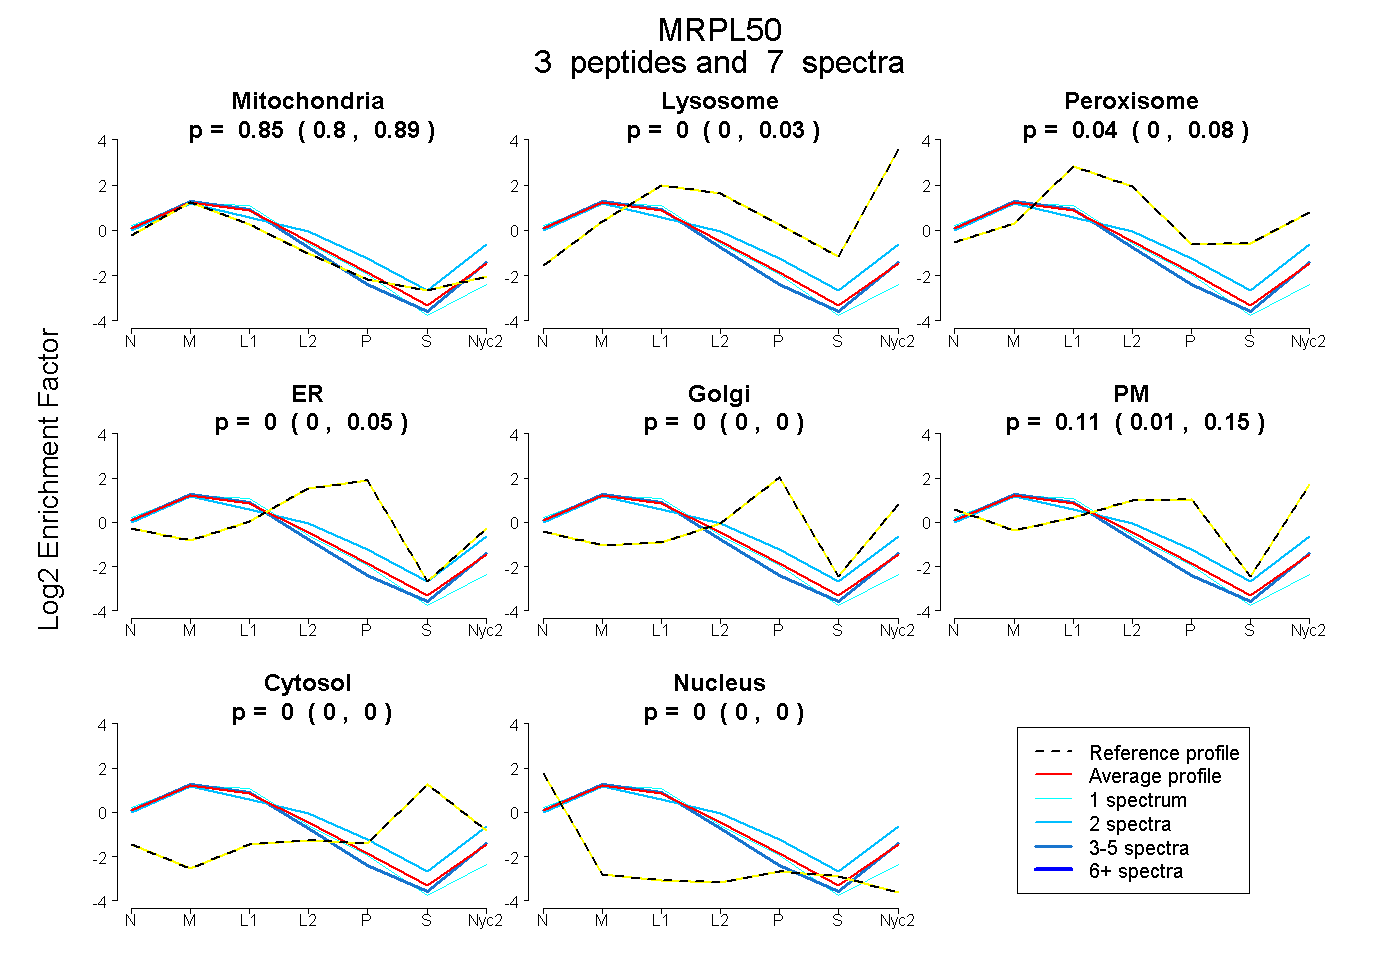
| Expt A |
3 peptides |
7 spectra |
|
0.847 0.804 | 0.888 |
0.000 0.000 | 0.031 |
0.043 0.000 | 0.079 |
0.000 0.000 | 0.050 |
0.000 0.000 | 0.000 |
0.110 0.014 | 0.154 |
0.000 0.000 | 0.000 |
0.000 0.000 | 0.000 |
| 2 spectra, LLANLADDLGHAVPNSR | 0.663 | 0.075 | 0.043 | 0.000 | 0.000 | 0.219 | 0.000 | 0.000 | ||
| 1 spectrum, APALVCPPLR | 0.957 | 0.000 | 0.000 | 0.043 | 0.000 | 0.000 | 0.000 | 0.000 | ||
| 4 spectra, AYTPPSDLQSR | 0.934 | 0.037 | 0.000 | 0.000 | 0.000 | 0.029 | 0.000 | 0.000 |
| Plot | Mito | Lyso or Perox | ER | Golgi | PM | Cytosol | Nucleus | ||||||
| Expt B |
3 peptides |
4 spectra |
 |
0.957 0.888 | 1.000 |
0.000 0.000 | 0.023 |
0.043 0.000 | 0.086 |
0.000 0.000 | 0.040 |
0.000 0.000 | 0.027 |
0.000 0.000 | 0.000 |
0.000 0.000 | 0.000 |
|||
| Plot | Lyso | Other | |||||||||||
| Expt C |
5 peptides |
21 spectra |
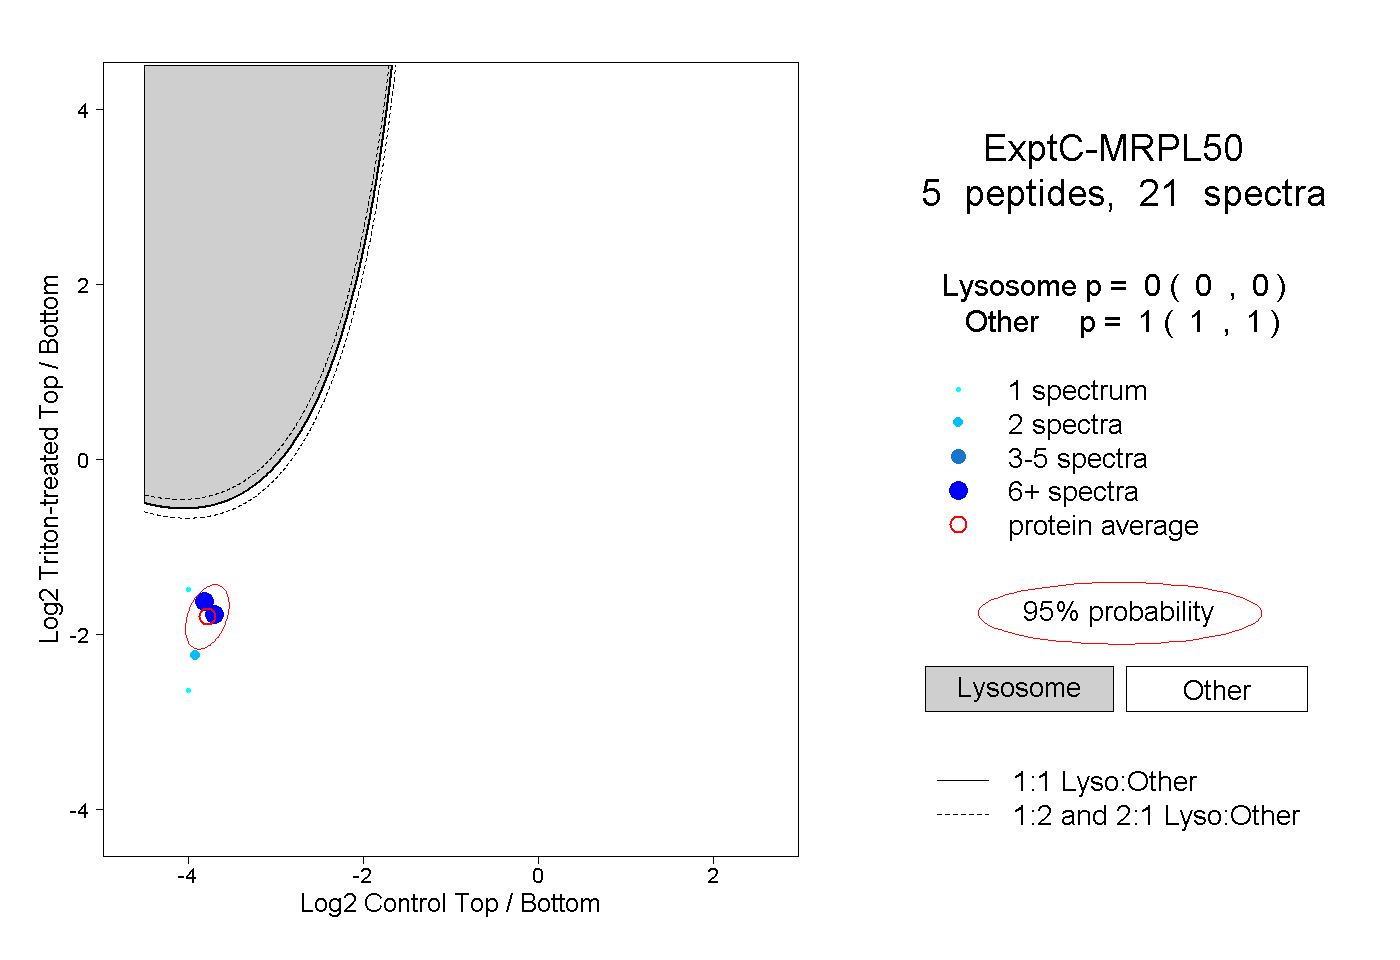 |
0.000 0.000 | 0.000 |
1.000 1.000 | 1.000 |
||||||||
| Plot | Lyso | Other | |||||||||||
| Expt D |
1 peptide |
2 spectra |
 |
0.000 NA | NA |
1.000 NA | NA |