 7
7peptides
spectra
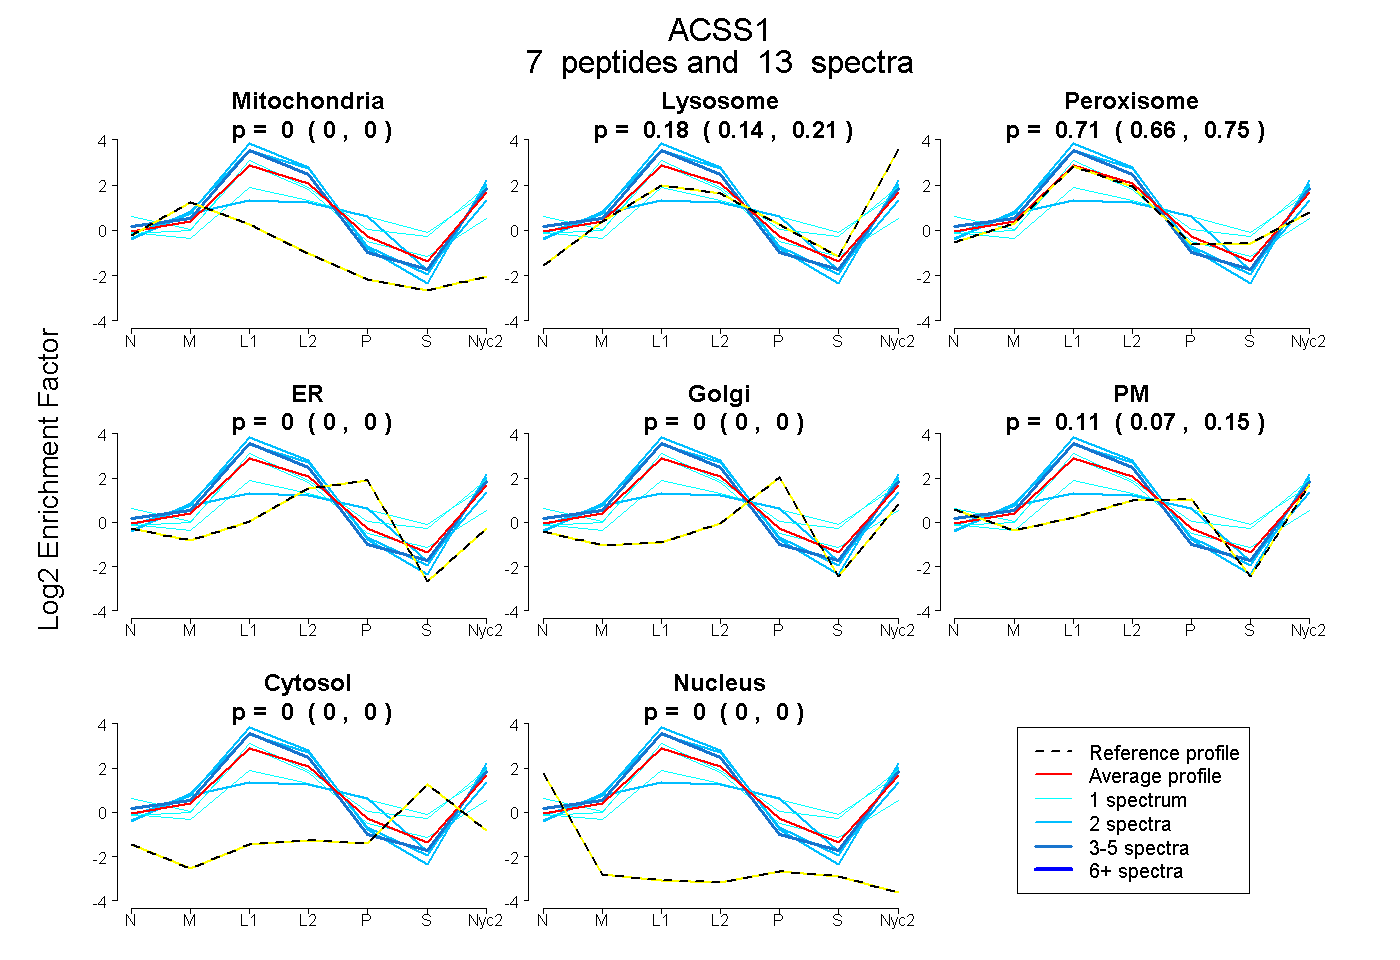
0.000 | 0.000
0.141 | 0.210
0.662 | 0.752
0.000 | 0.000
0.000 | 0.000
0.068 | 0.148
0.000 | 0.000
0.000 | 0.000
1peptide
spectrum
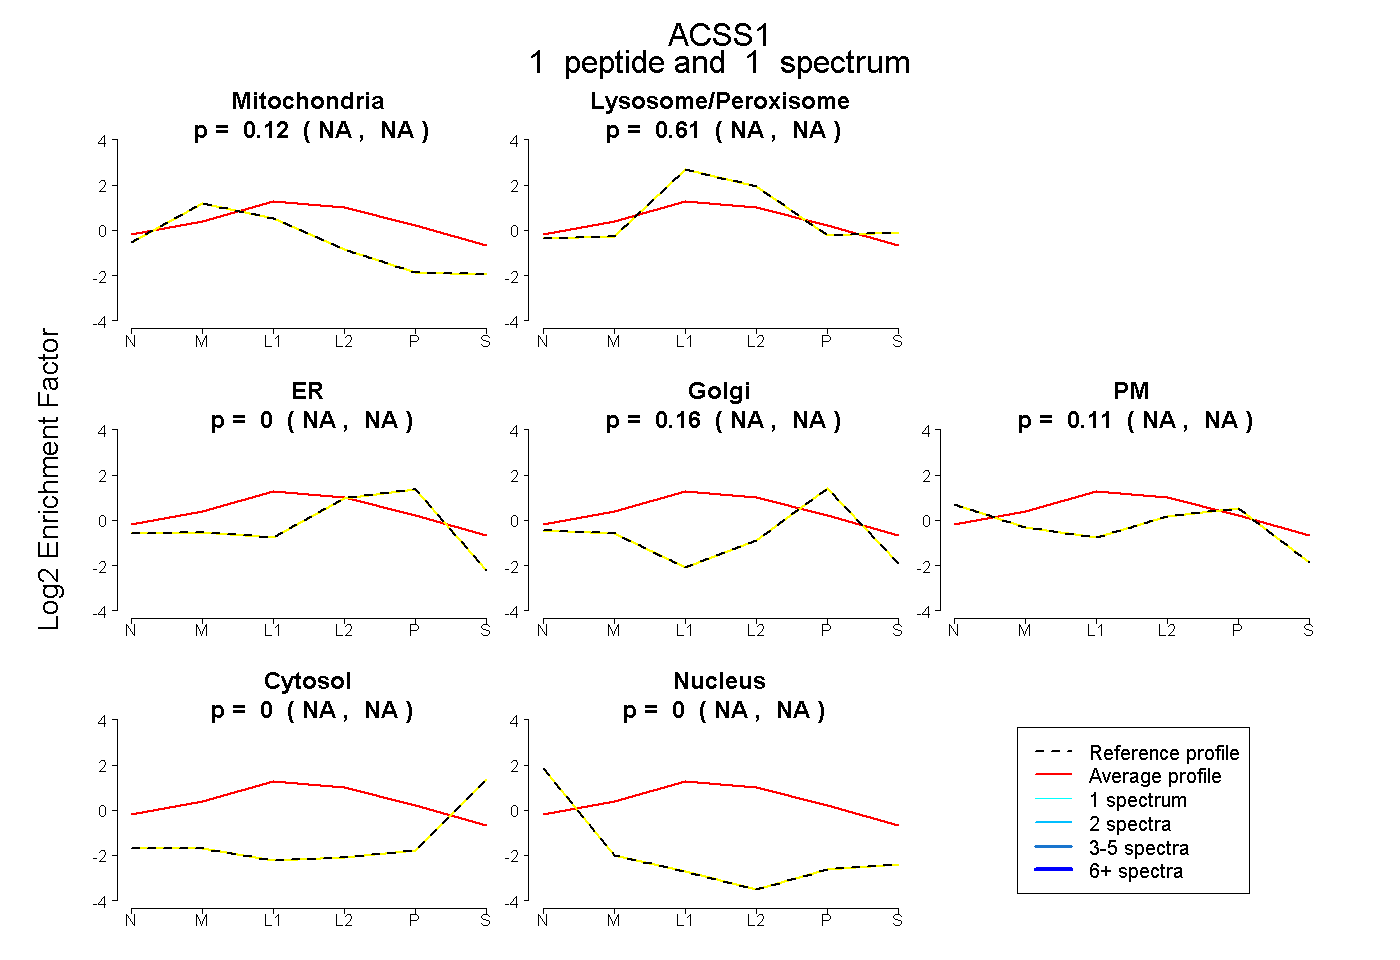
NA | NA
NA | NA
NA | NA
NA | NA
NA | NA
NA | NA
NA | NA
21peptides
spectra
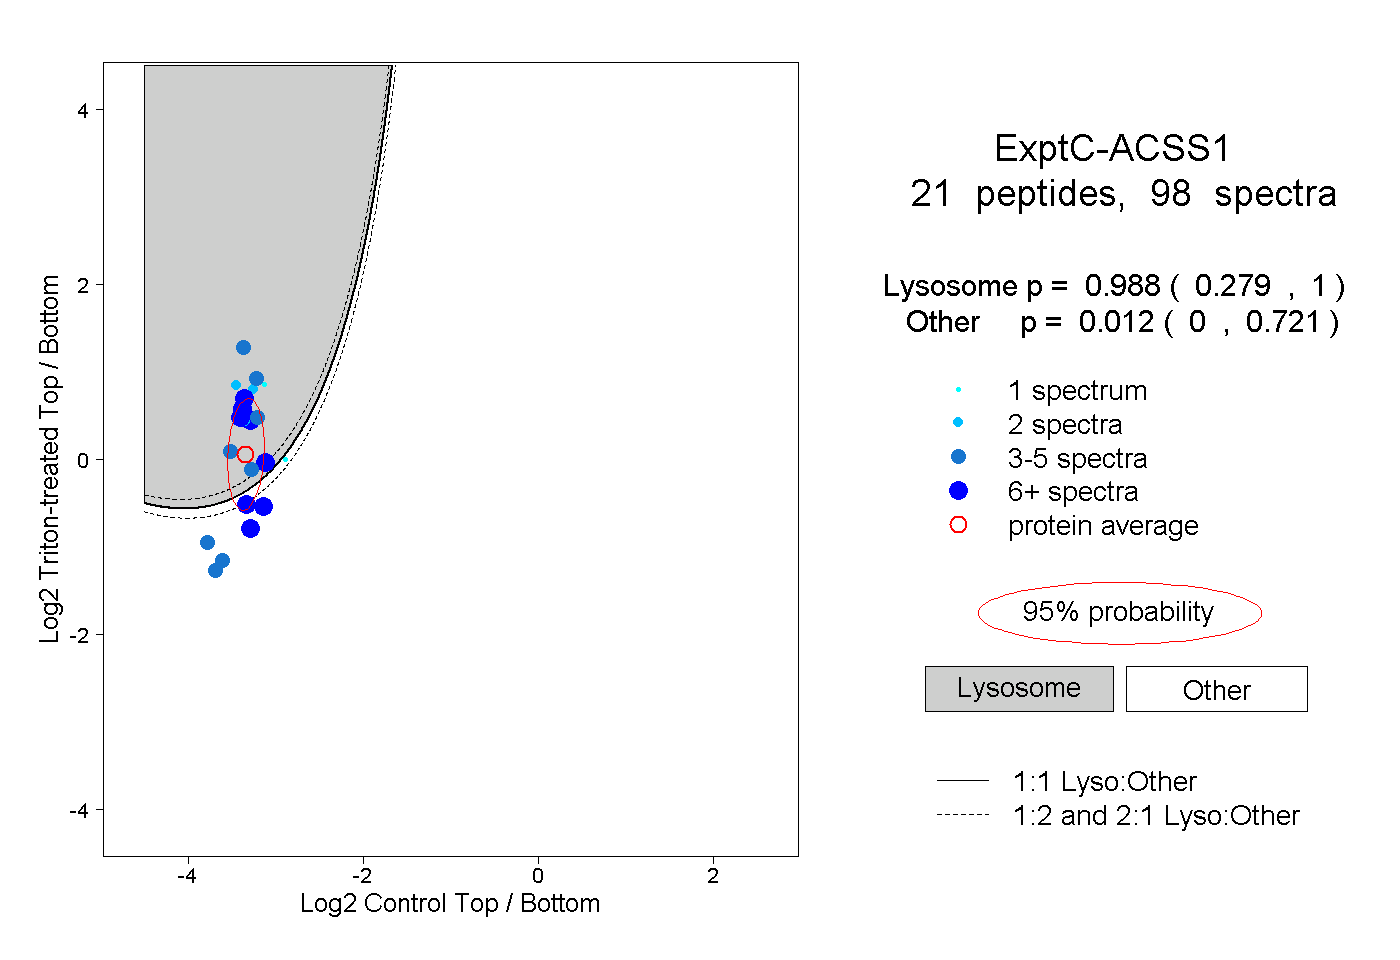
0.279 | 1.000
0.000 | 0.721
3peptides
spectra
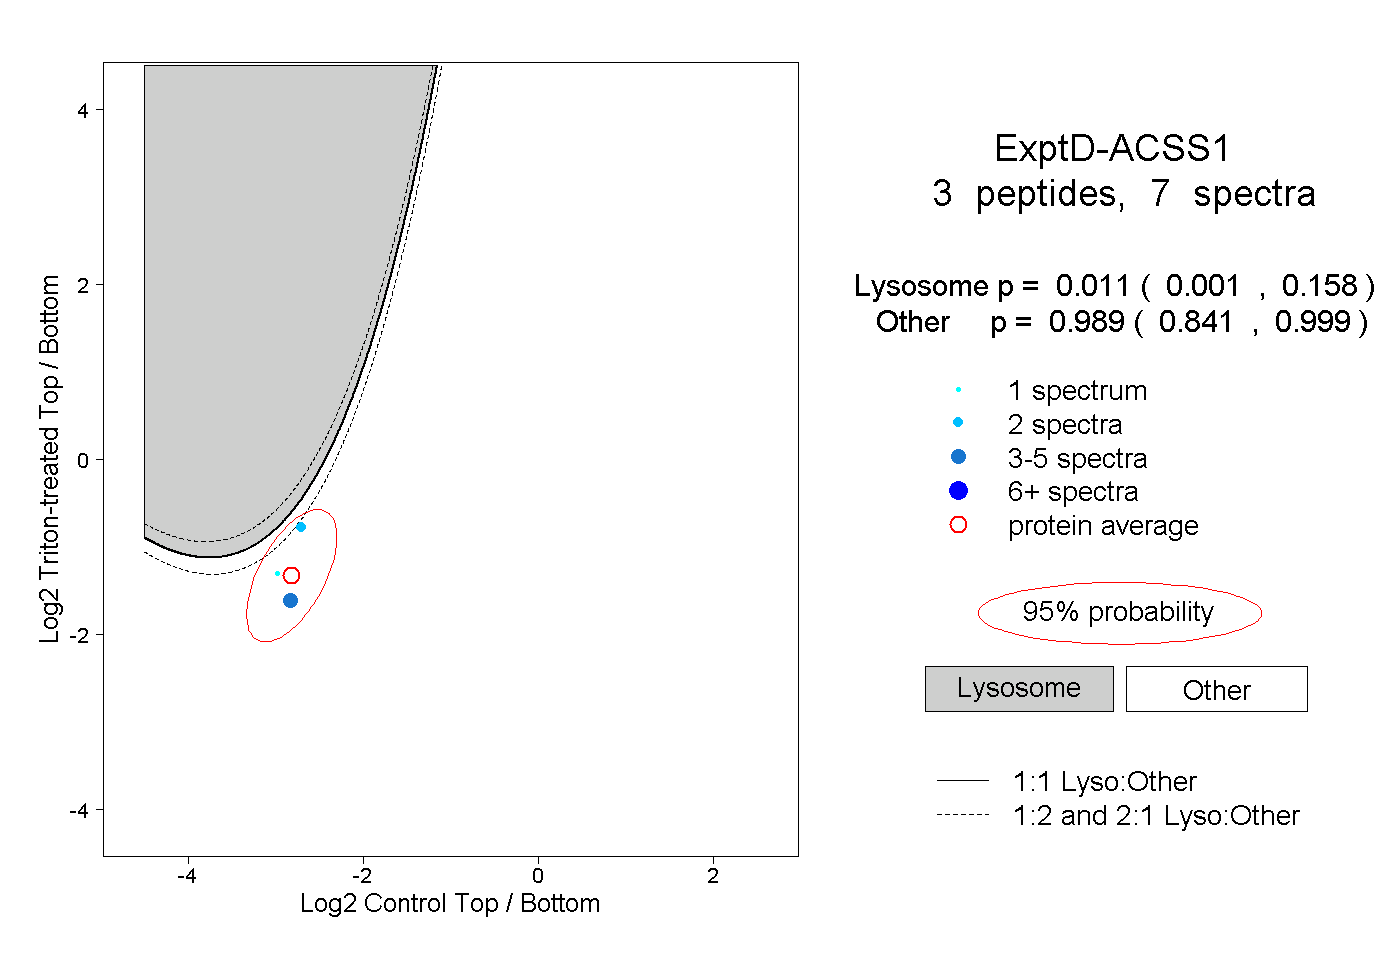
0.001 | 0.158
0.841 | 0.999