 5
5peptides
spectra
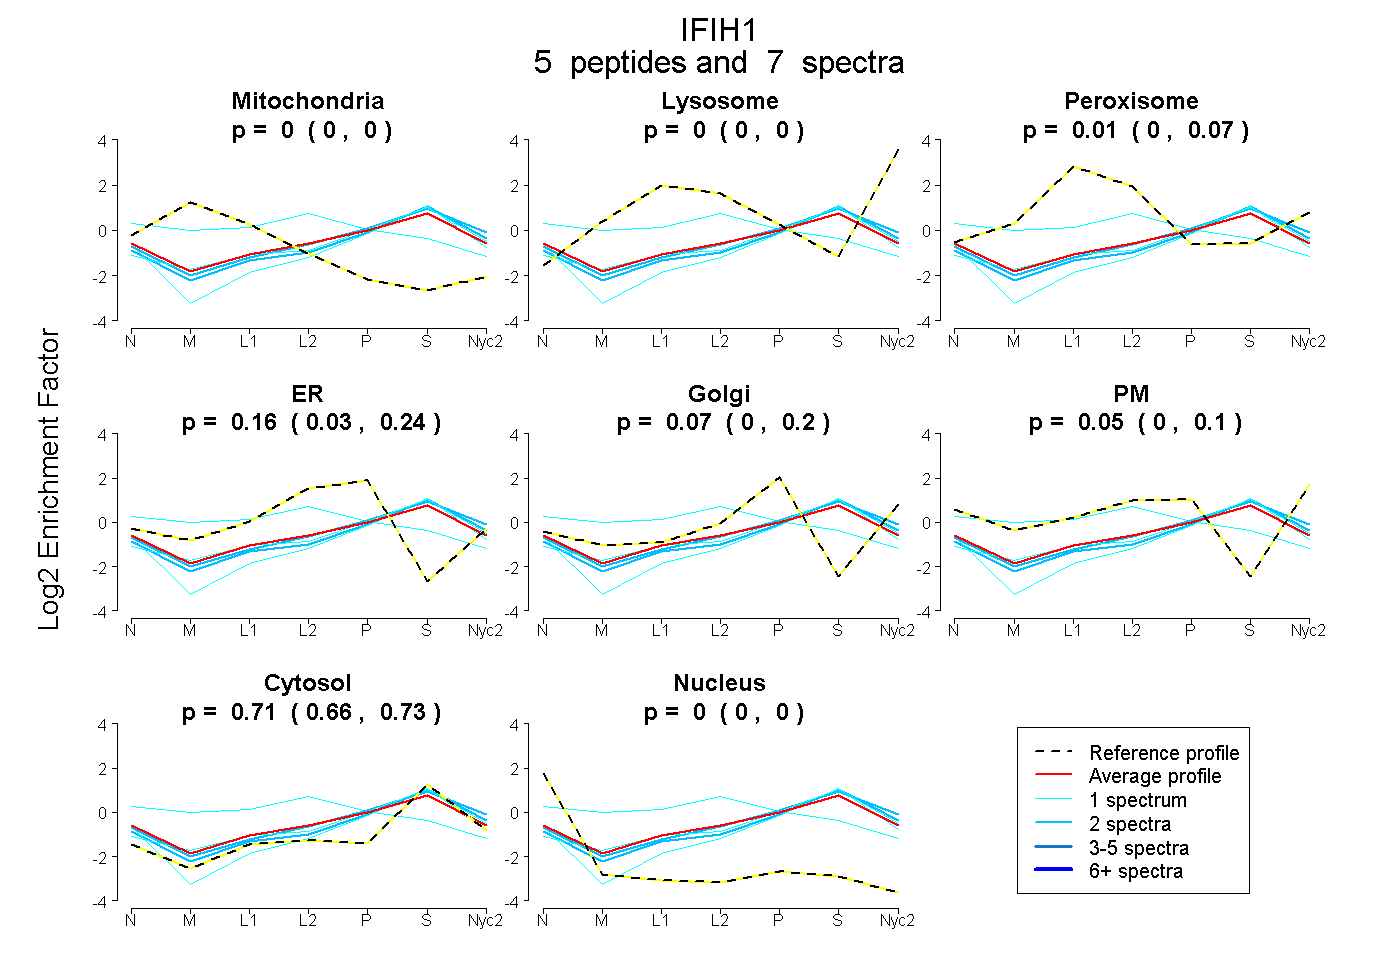
0.000 | 0.000
0.000 | 0.000
0.000 | 0.074
0.035 | 0.237
0.000 | 0.196
0.000 | 0.095
0.660 | 0.734
0.000 | 0.000
2peptides
spectra
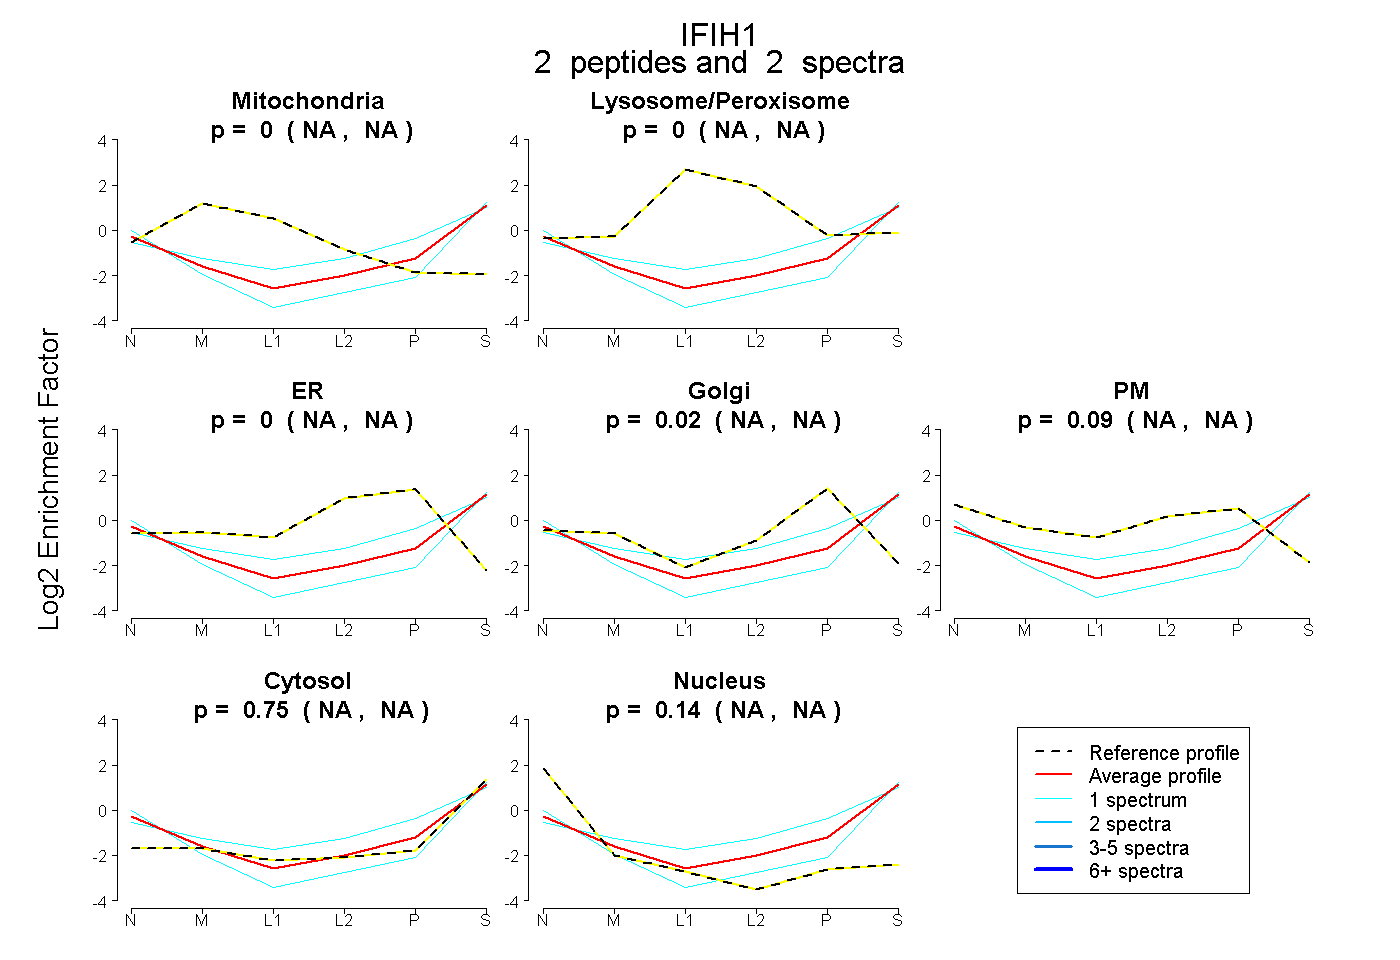
NA | NA
NA | NA
NA | NA
NA | NA
NA | NA
NA | NA
NA | NA
7peptides
spectra
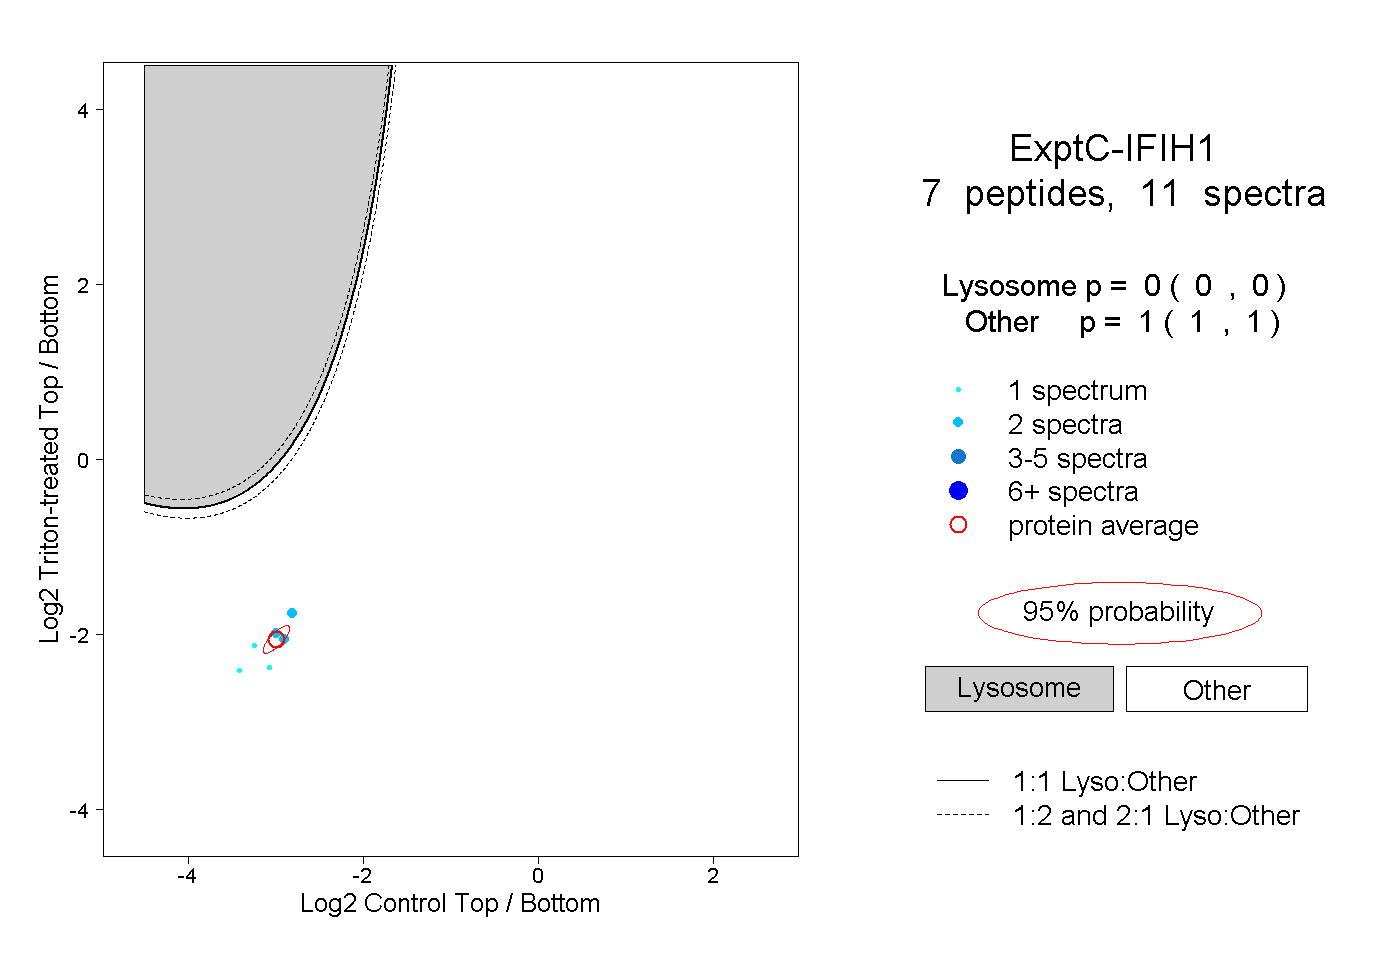
0.000 | 0.000
1.000 | 1.000