 5
5peptides
spectra
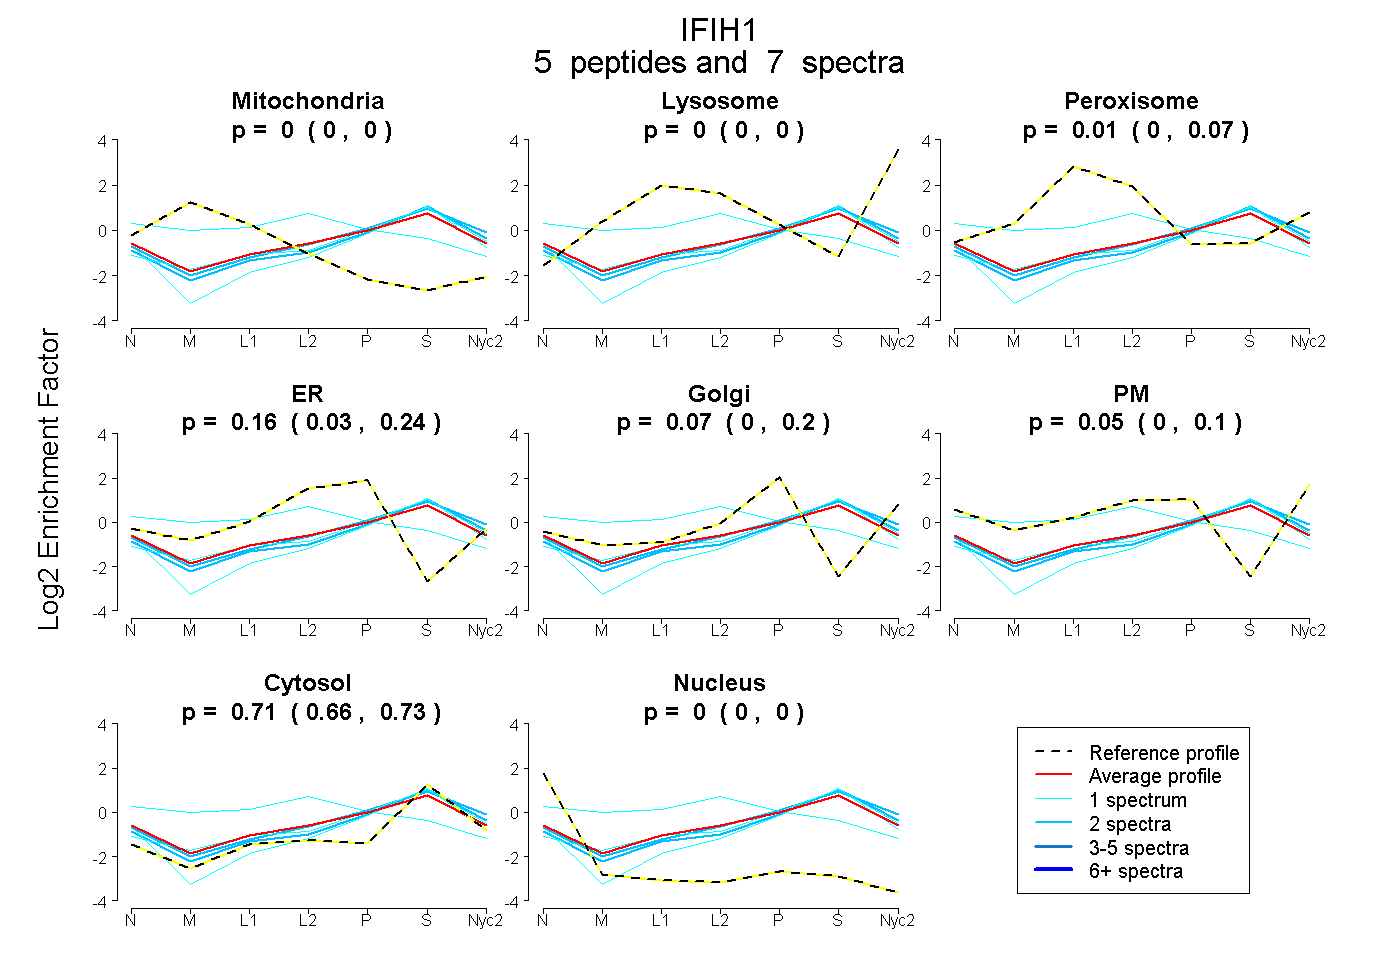
0.000 | 0.000
0.000 | 0.000
0.000 | 0.074
0.035 | 0.237
0.000 | 0.196
0.000 | 0.095
0.660 | 0.734
0.000 | 0.000
| Plot | Mito | Lyso | Perox | ER | Golgi | PM | Cytosol | Nucleus | |||||
| Expt A |
5 peptides |
7 spectra |
|
0.000 0.000 | 0.000 |
0.000 0.000 | 0.000 |
0.008 0.000 | 0.074 |
0.162 0.035 | 0.237 |
0.074 0.000 | 0.196 |
0.048 0.000 | 0.095 |
0.708 0.660 | 0.734 |
0.000 0.000 | 0.000 |
| 2 spectra, FVIADDTR | 0.000 | 0.000 | 0.000 | 0.000 | 0.226 | 0.000 | 0.774 | 0.000 | ||
| 1 spectrum, ADESTYVLVTSSGSGVTER | 0.174 | 0.000 | 0.263 | 0.309 | 0.000 | 0.000 | 0.226 | 0.029 | ||
| 1 spectrum, VAVYITK | 0.000 | 0.000 | 0.058 | 0.000 | 0.217 | 0.000 | 0.725 | 0.000 | ||
| 2 spectra, NTILEQFTR | 0.000 | 0.016 | 0.000 | 0.000 | 0.192 | 0.083 | 0.709 | 0.000 | ||
| 1 spectrum, ISAAGNSGNESGVR | 0.000 | 0.000 | 0.000 | 0.000 | 0.135 | 0.000 | 0.830 | 0.035 |
| Plot | Mito | Lyso or Perox | ER | Golgi | PM | Cytosol | Nucleus | ||||||
| Expt B |
2 peptides |
2 spectra |
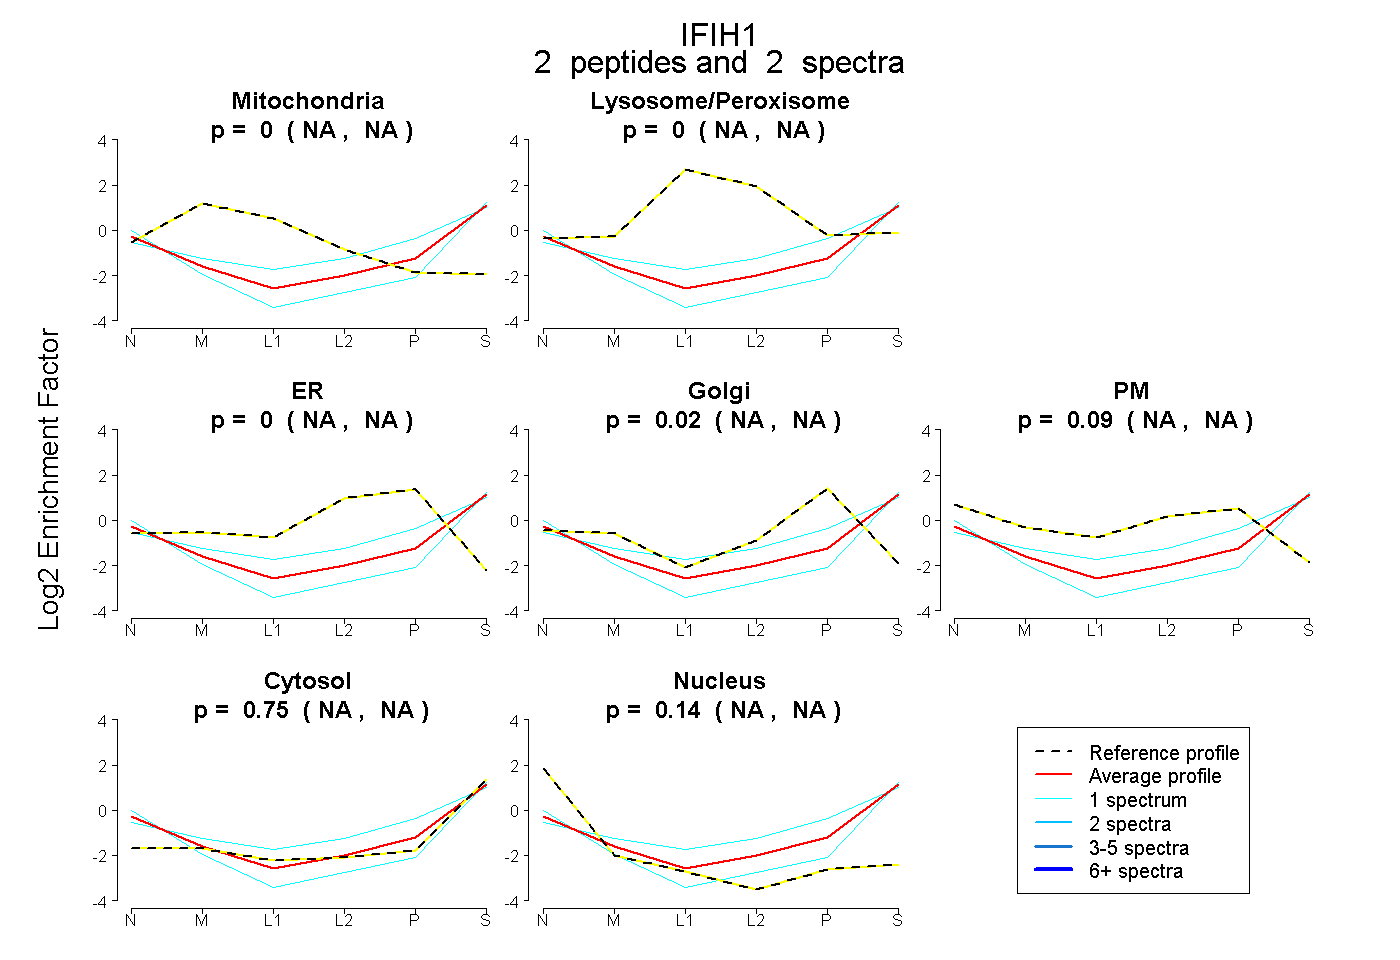 |
0.000 NA | NA |
0.000 NA | NA |
0.000 NA | NA |
0.023 NA | NA |
0.087 NA | NA |
0.753 NA | NA |
0.137 NA | NA |
|||
| Plot | Lyso | Other | |||||||||||
| Expt C |
7 peptides |
11 spectra |
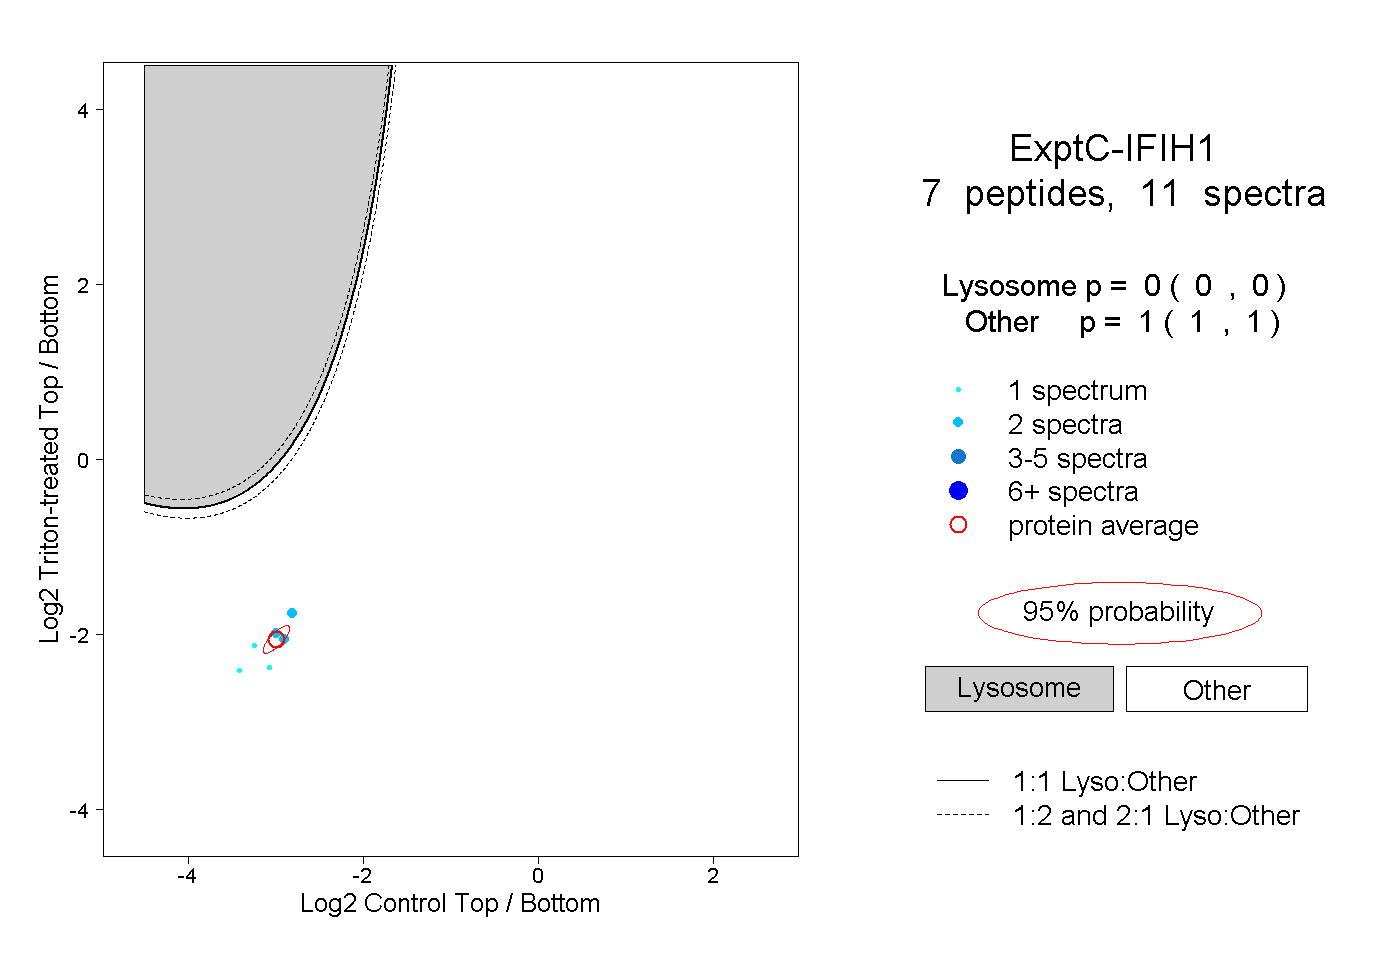 |
0.000 0.000 | 0.000 |
1.000 1.000 | 1.000 |