 6
6peptides
spectra

0.000 | 0.000
0.000 | 0.000
0.000 | 0.000
0.834 | 0.894
0.038 | 0.095
0.000 | 0.007
0.000 | 0.000
0.056 | 0.067
2peptides
spectra

0.000 | 0.000
0.000 | 0.000
0.822 | 0.948
0.000 | 0.099
0.000 | 0.030
0.000 | 0.000
0.008 | 0.052
4peptides
spectra
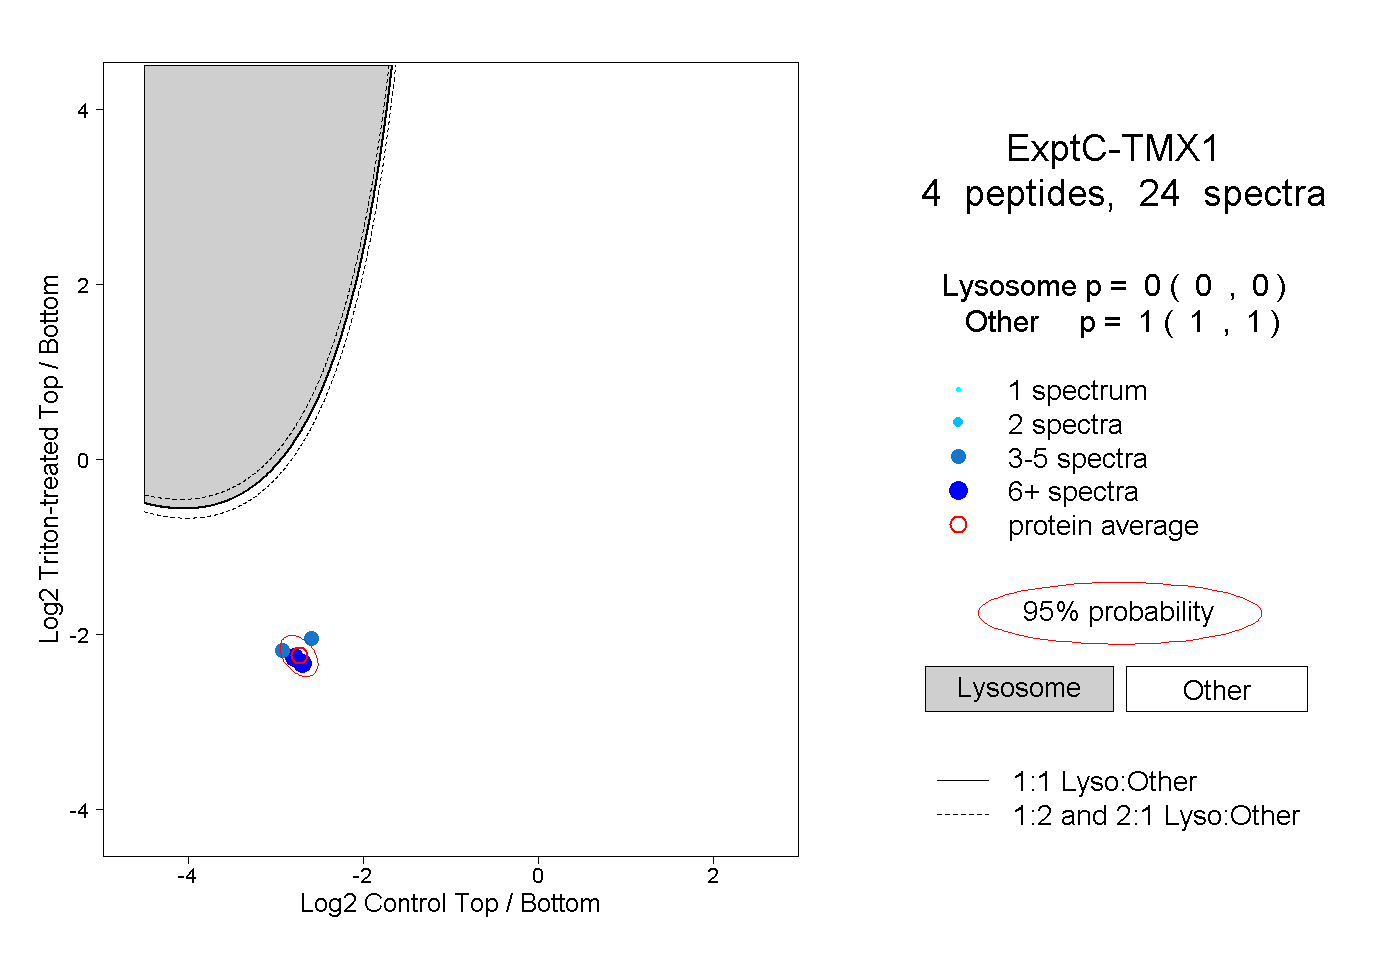
0.000 | 0.000
1.000 | 1.000
2peptides
spectra
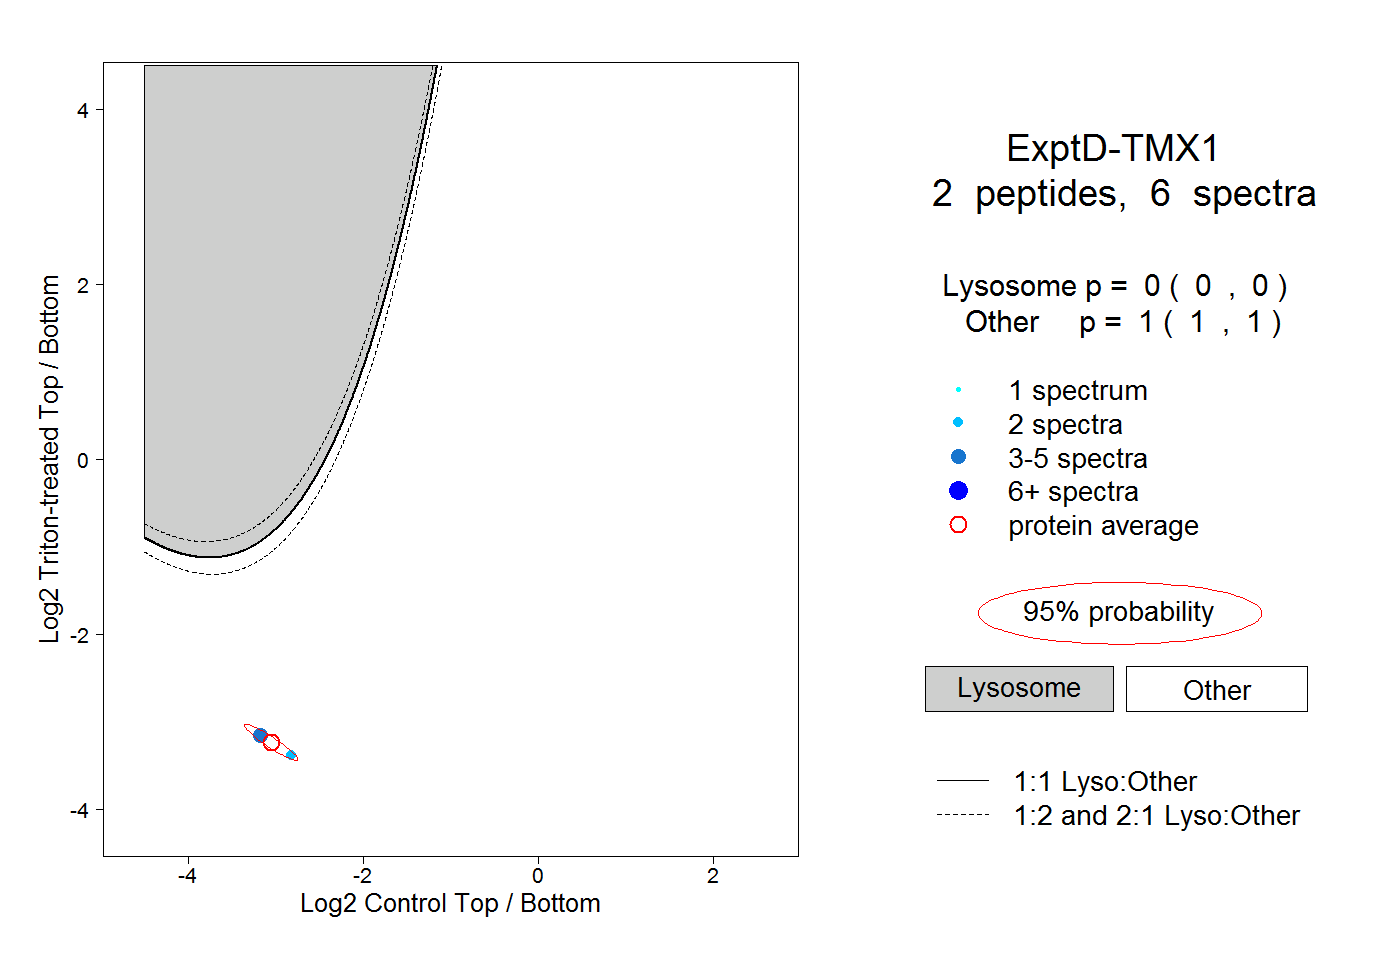
0.000 | 0.000
1.000 | 1.000