 6
6peptides
spectra

0.000 | 0.000
0.000 | 0.000
0.000 | 0.000
0.834 | 0.894
0.038 | 0.095
0.000 | 0.007
0.000 | 0.000
0.056 | 0.067
| Plot | Mito | Lyso | Perox | ER | Golgi | PM | Cytosol | Nucleus | |||||
| Expt A |
6 peptides |
28 spectra |
|
0.000 0.000 | 0.000 |
0.000 0.000 | 0.000 |
0.000 0.000 | 0.000 |
0.867 0.834 | 0.894 |
0.071 0.038 | 0.095 |
0.000 0.000 | 0.007 |
0.000 0.000 | 0.000 |
0.062 0.056 | 0.067 |
| 5 spectra, RPQQQPTK | 0.000 | 0.000 | 0.000 | 0.964 | 0.000 | 0.000 | 0.000 | 0.036 | ||
| 6 spectra, VDVTEQTGLSGR | 0.000 | 0.000 | 0.000 | 0.941 | 0.005 | 0.023 | 0.000 | 0.031 | ||
| 9 spectra, DTPQSGLR | 0.000 | 0.000 | 0.000 | 0.604 | 0.201 | 0.000 | 0.069 | 0.127 | ||
| 4 spectra, DFINFISEK | 0.000 | 0.000 | 0.000 | 0.754 | 0.063 | 0.142 | 0.000 | 0.042 | ||
| 2 spectra, DGEFR | 0.000 | 0.000 | 0.000 | 0.958 | 0.020 | 0.000 | 0.000 | 0.021 | ||
| 2 spectra, FIITALPSIYHCK | 0.006 | 0.000 | 0.000 | 0.885 | 0.000 | 0.053 | 0.000 | 0.056 |
| Plot | Mito | Lyso or Perox | ER | Golgi | PM | Cytosol | Nucleus | ||||||
| Expt B |
2 peptides |
7 spectra |
 |
0.000 0.000 | 0.000 |
0.000 0.000 | 0.000 |
0.914 0.822 | 0.948 |
0.047 0.000 | 0.099 |
0.000 0.000 | 0.030 |
0.000 0.000 | 0.000 |
0.039 0.008 | 0.052 |
|||
| Plot | Lyso | Other | |||||||||||
| Expt C |
4 peptides |
24 spectra |
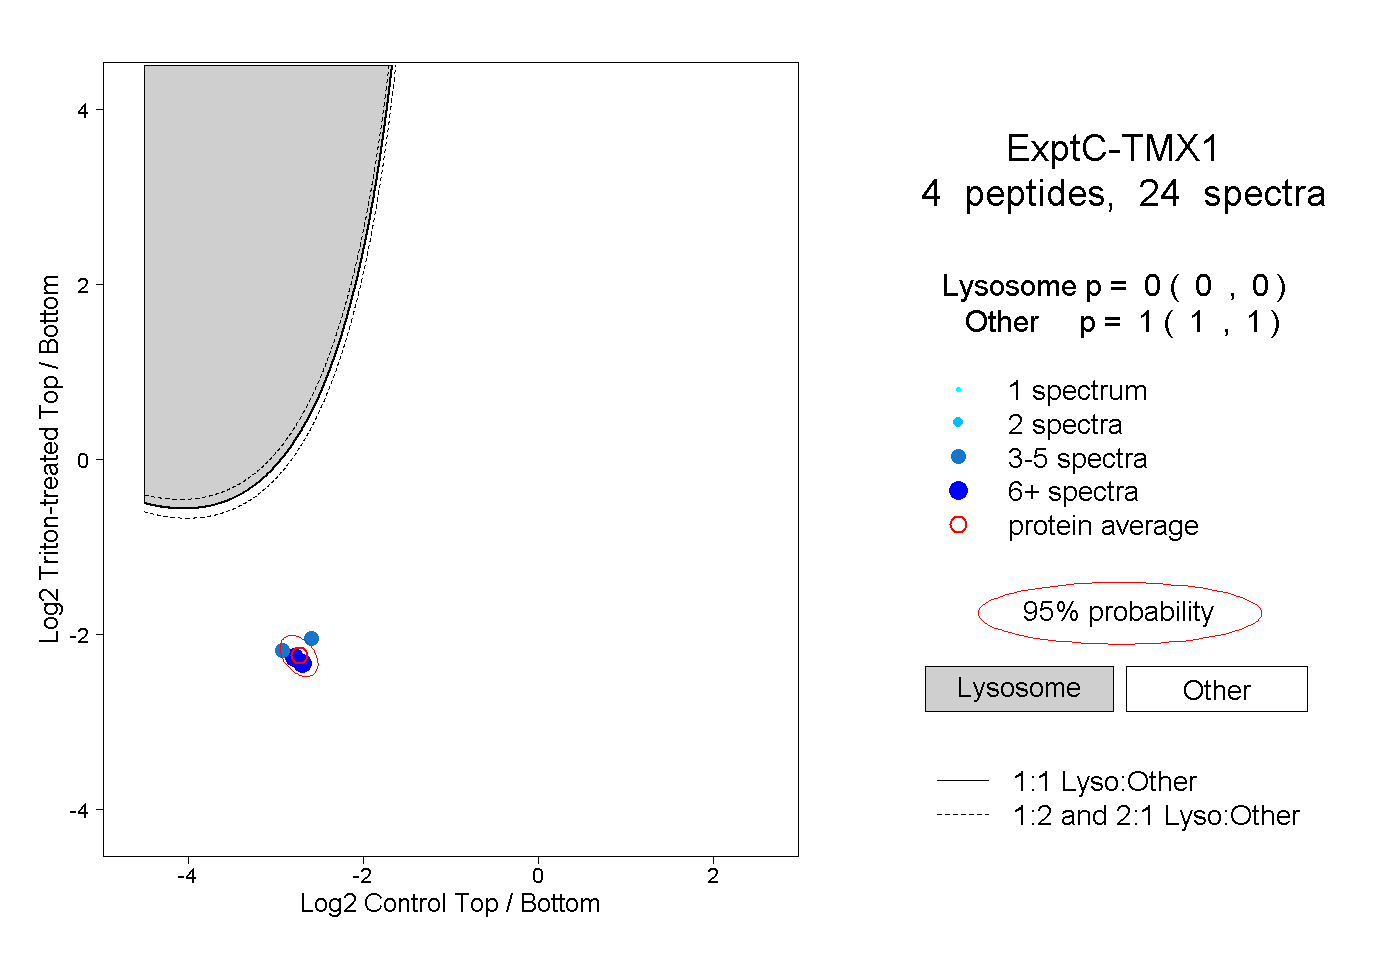 |
0.000 0.000 | 0.000 |
1.000 1.000 | 1.000 |
||||||||
| Plot | Lyso | Other | |||||||||||
| Expt D |
2 peptides |
6 spectra |
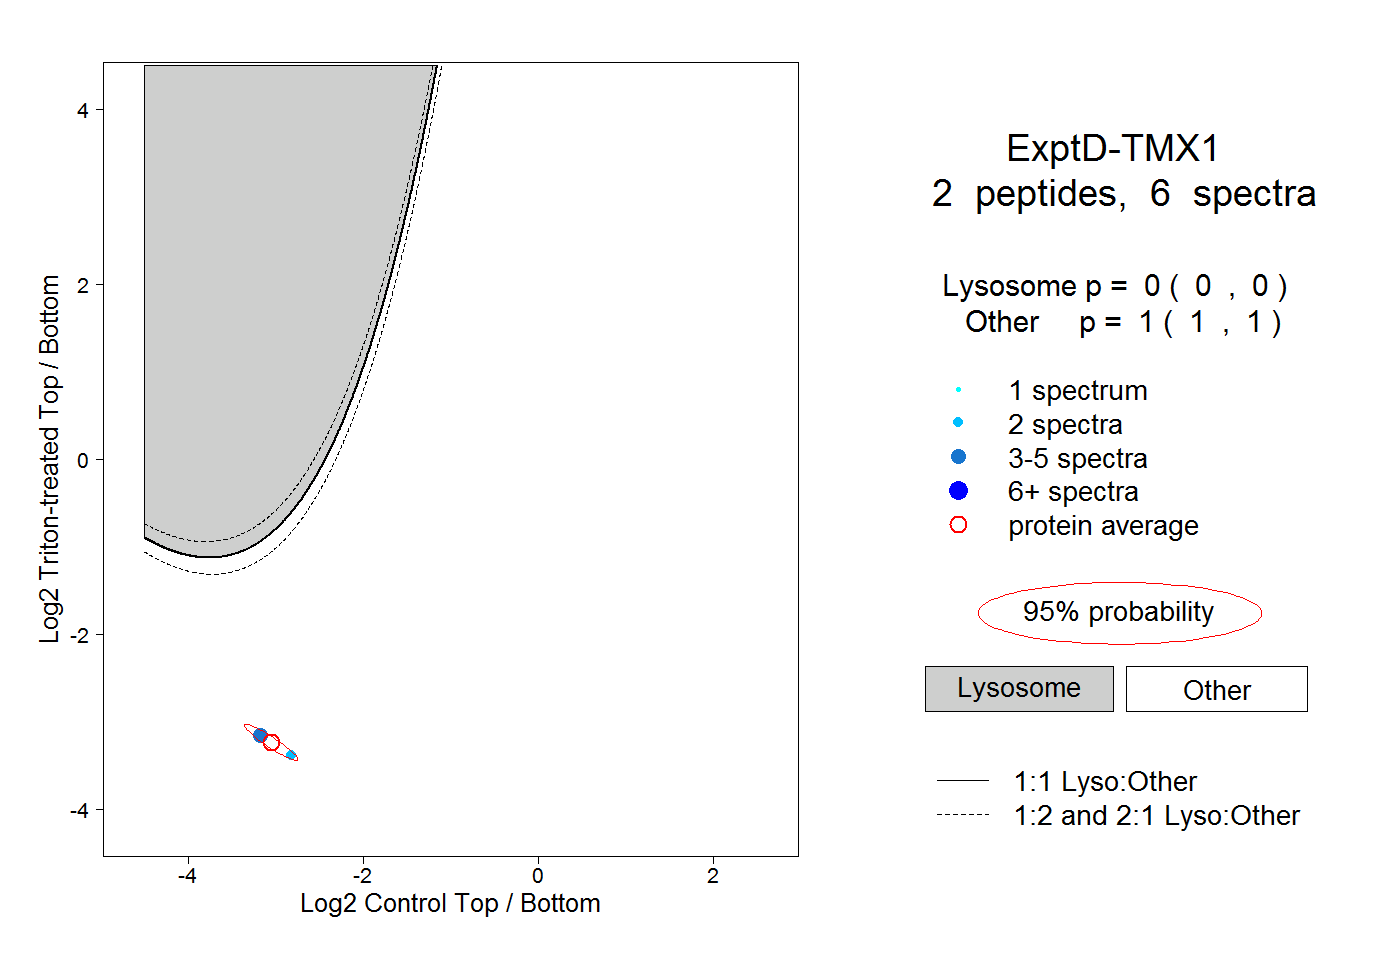 |
0.000 0.000 | 0.000 |
1.000 1.000 | 1.000 |