 2
2peptides
spectra
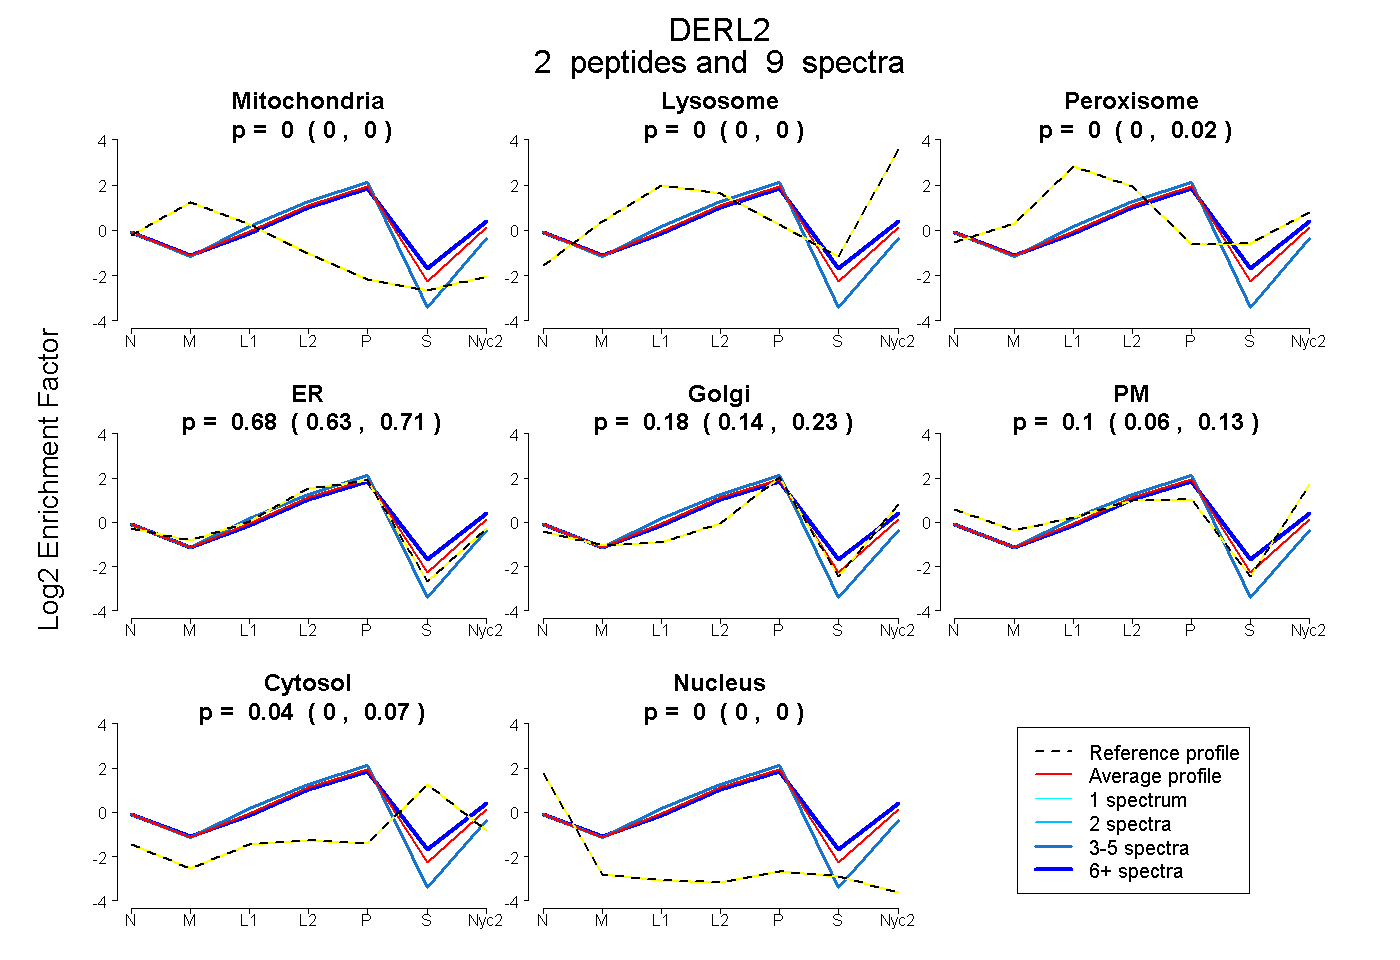
0.000 | 0.000
0.000 | 0.000
0.000 | 0.021
0.626 | 0.714
0.142 | 0.233
0.057 | 0.127
0.000 | 0.065
0.000 | 0.004
3peptides
spectra
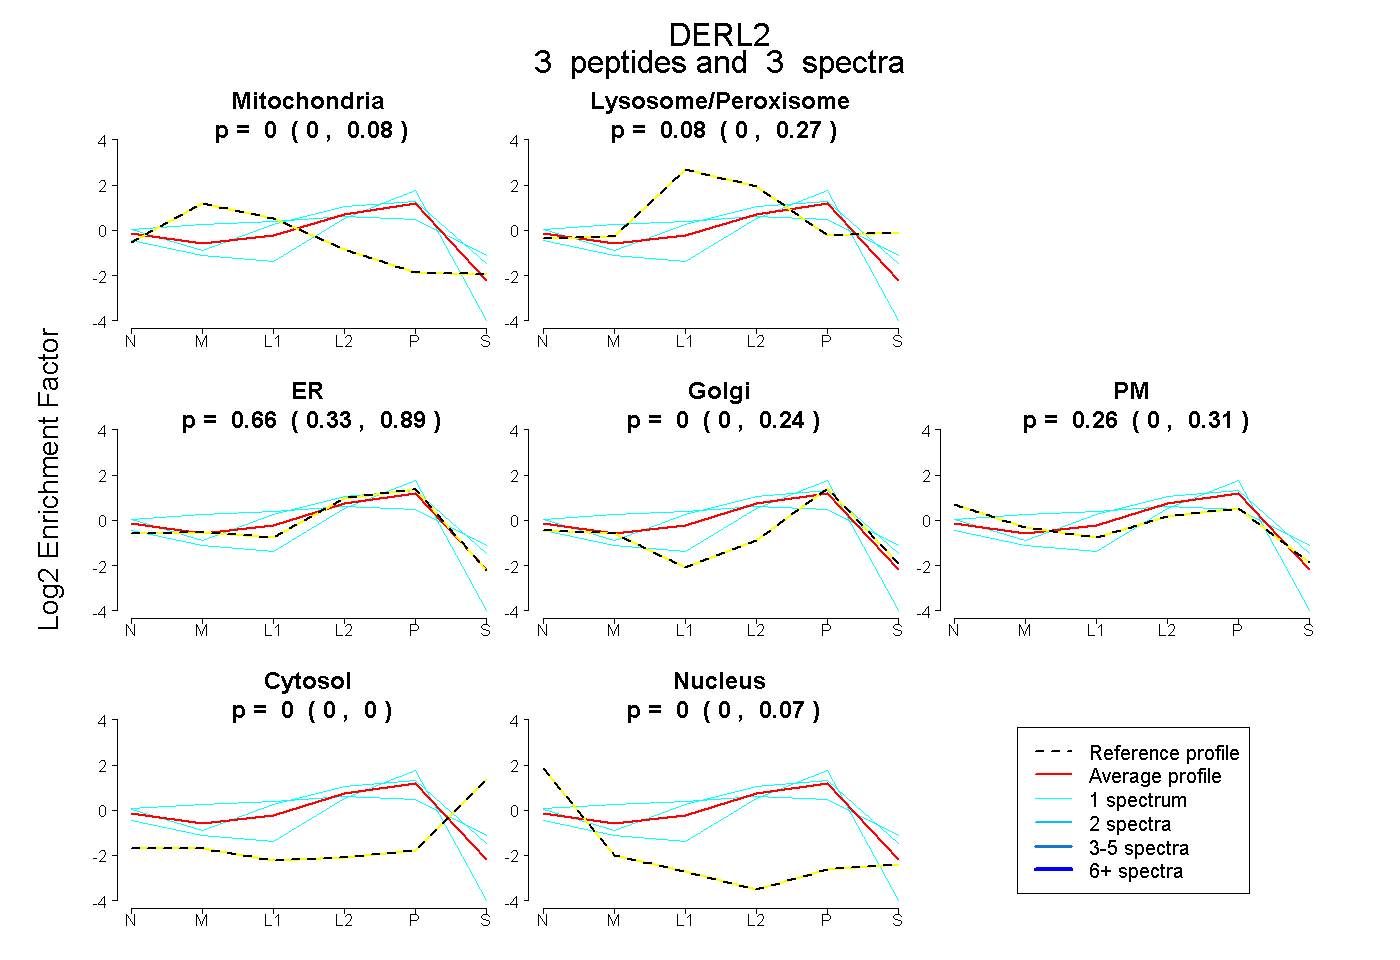
0.000 | 0.079
0.000 | 0.270
0.330 | 0.893
0.000 | 0.239
0.000 | 0.314
0.000 | 0.000
0.000 | 0.071
3peptides
spectra

0.000 | 0.000
1.000 | 1.000
3peptides
spectra
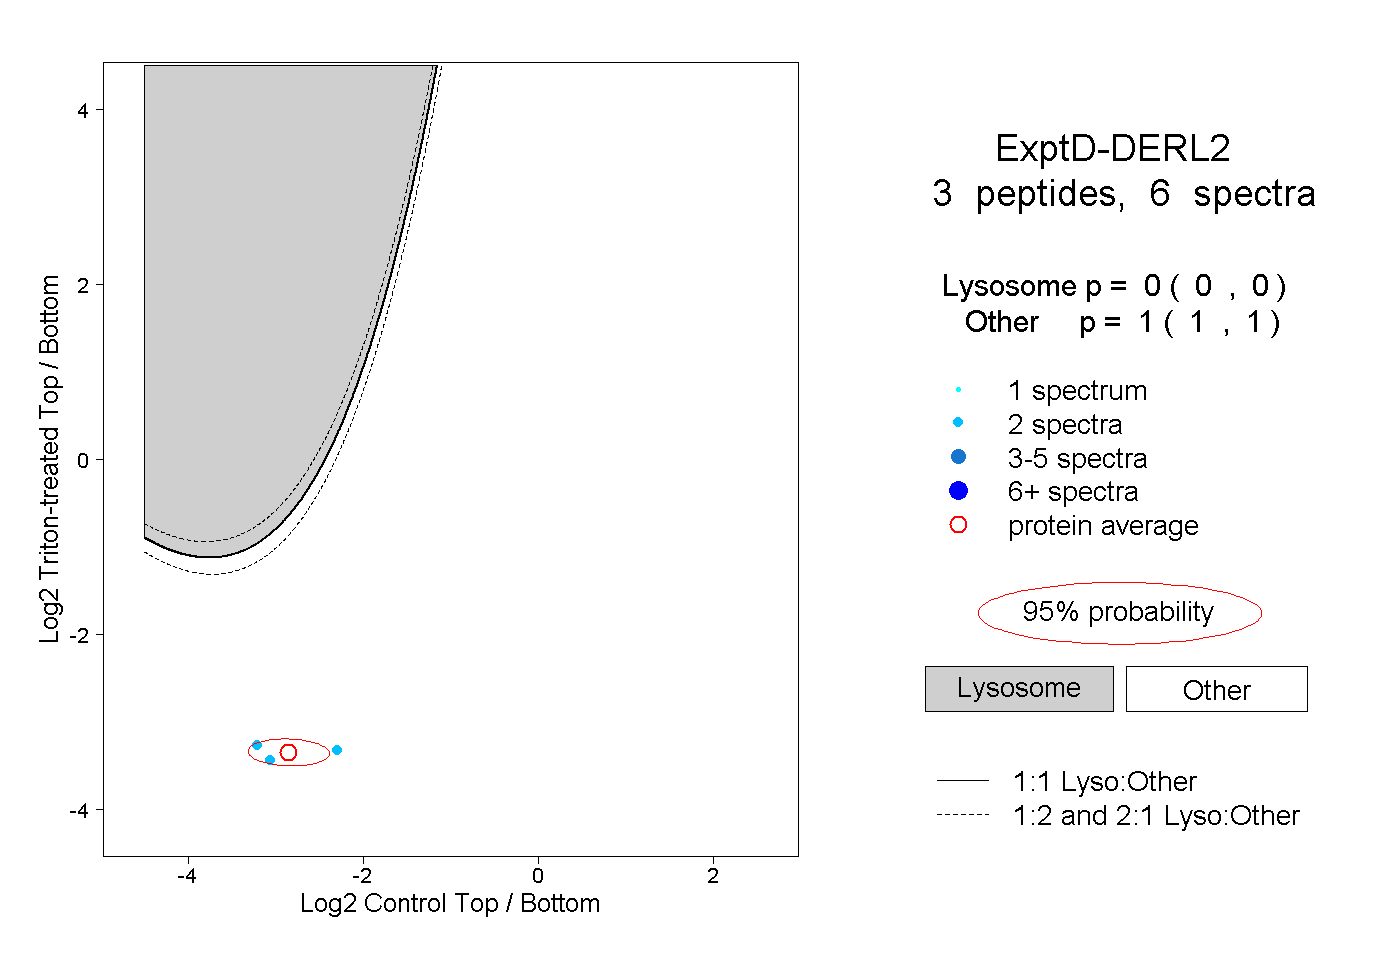
0.000 | 0.000
1.000 | 1.000