DERL2
[ENSRNOP00000009585]
Main page
| | | Plot |
Mito |
Lyso |
|
Perox |
ER |
Golgi |
PM |
Cytosol |
Nucleus |
|
| Expt A |
 2
2
peptides |
9
spectra |
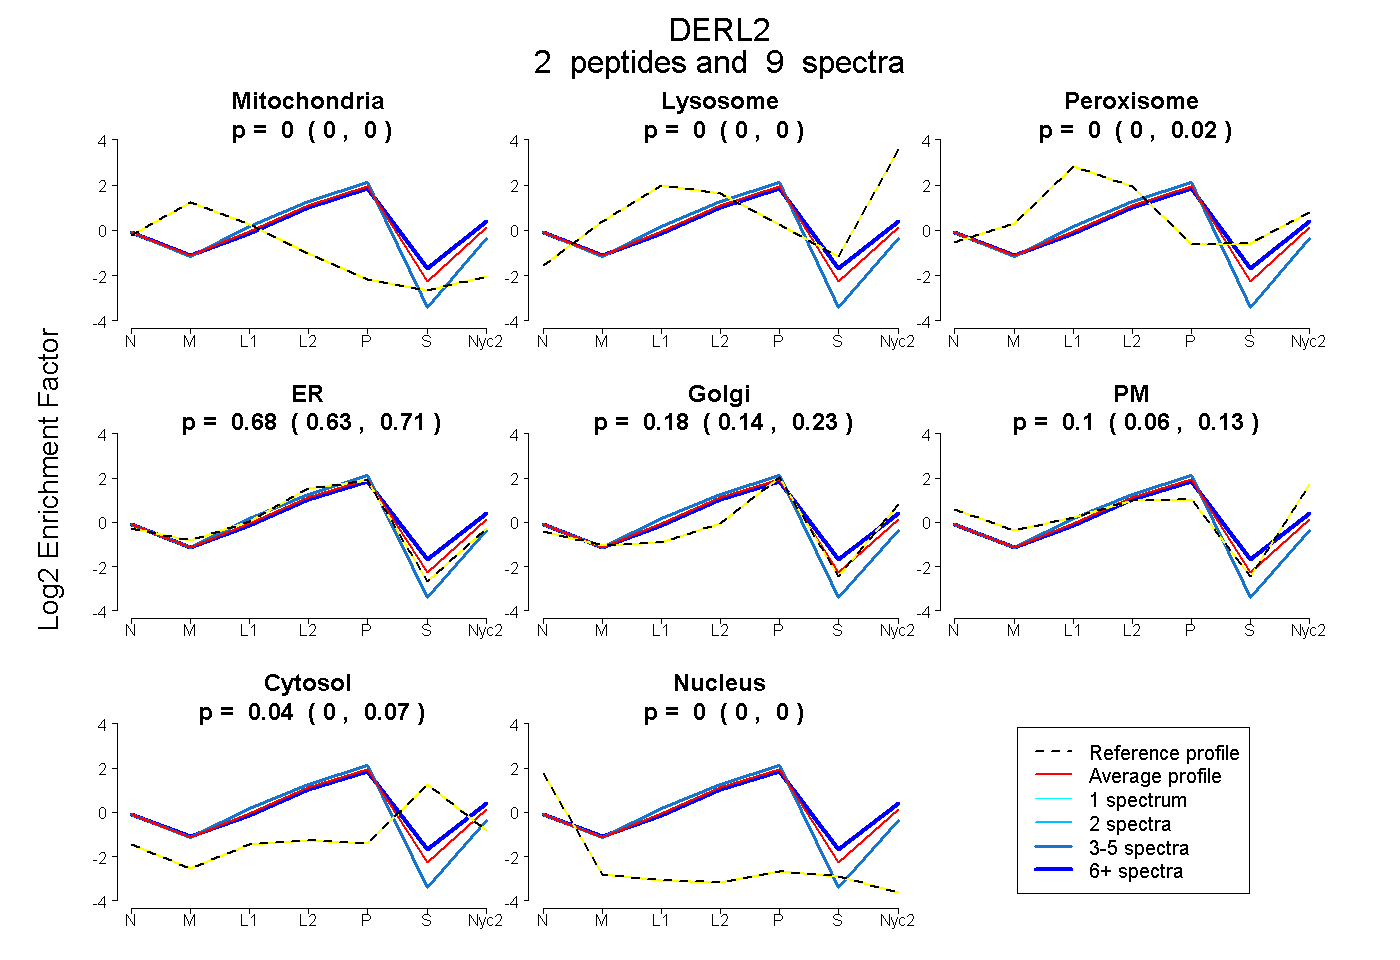 |
0.000
0.000 | 0.000 |
0.000
0.000 | 0.000 |
|
0.000
0.000 | 0.021 |
0.676
0.626 | 0.714 |
0.184
0.142 | 0.233 |
0.101
0.057 | 0.127 |
0.039
0.000 | 0.065 |
0.000
0.000 | 0.004 |
|
| | | Plot |
Mito |
|
Lyso or Perox |
|
ER |
Golgi |
PM |
Cytosol |
Nucleus |
|
| Expt B |
3
peptides |
3
spectra |
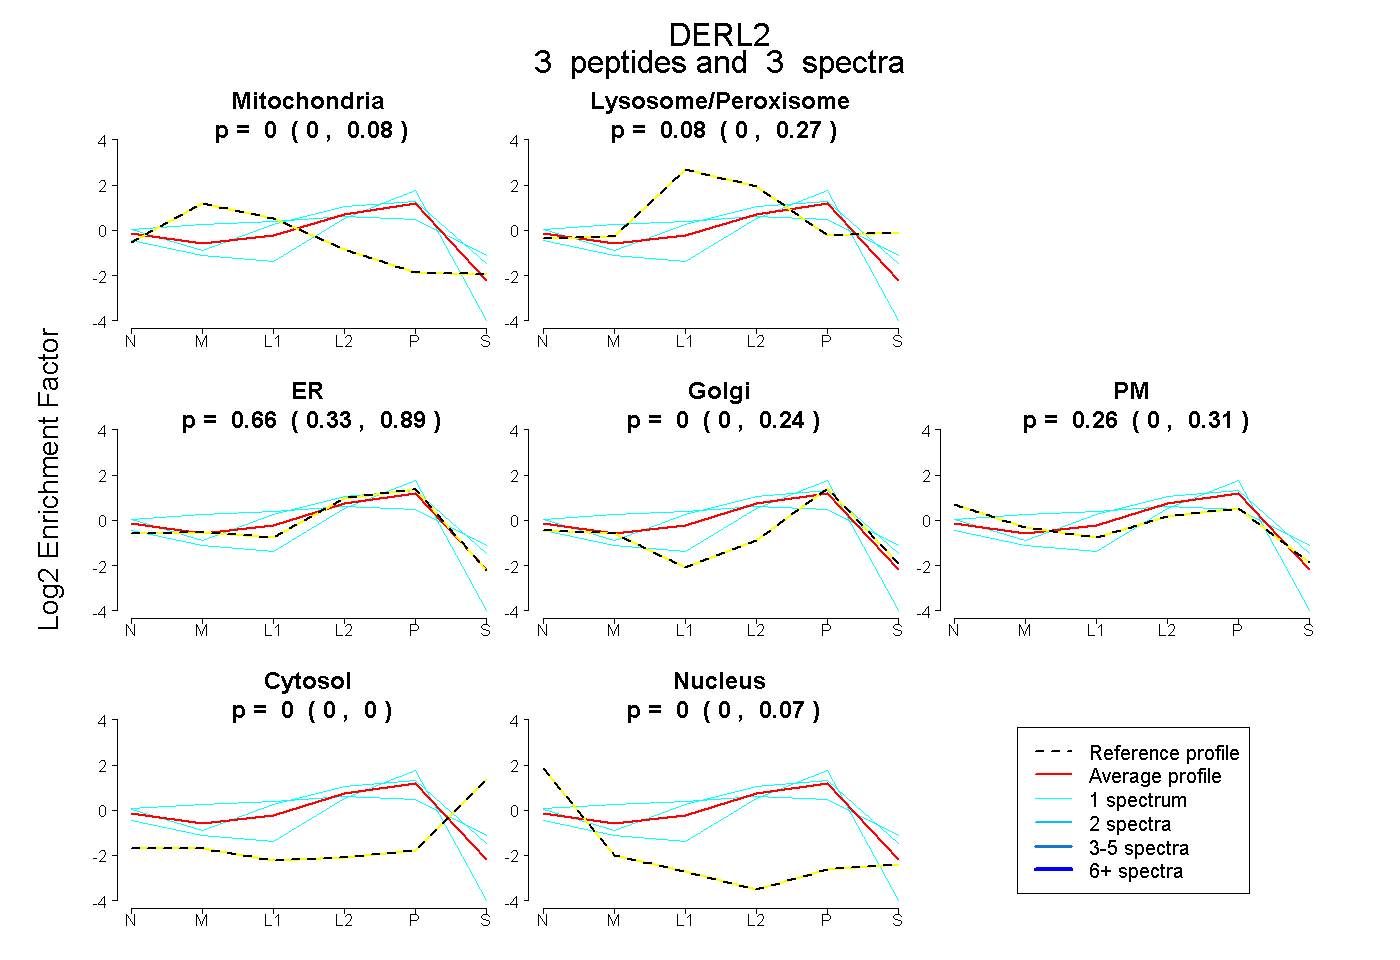 |
0.000
0.000 | 0.079 |
|
0.081
0.000 | 0.270 |
|
0.664
0.330 | 0.893 |
0.000
0.000 | 0.239 |
0.256
0.000 | 0.314 |
0.000
0.000 | 0.000 |
0.000
0.000 | 0.071 |
|
| 1 spectrum, MLEEGSFR |
0.000 |
|
0.258 |
|
0.566 |
0.009 |
0.167 |
0.000 |
0.000 |
|
| 1 spectrum, TPSILR |
0.000 |
|
0.000 |
|
0.804 |
0.172 |
0.000 |
0.000 |
0.024 |
|
| 1 spectrum, HFQIWR |
0.088 |
|
0.363 |
|
0.034 |
0.155 |
0.359 |
0.000 |
0.000 |
|
| | | Plot |
|
Lyso |
|
|
|
|
|
|
|
Other |
| Expt C |
3
peptides |
12
spectra |
 |
|
0.000
0.000 | 0.000 |
|
|
|
|
|
|
|
1.000
1.000 | 1.000 |
| | | Plot |
|
Lyso |
|
|
|
|
|
|
|
Other |
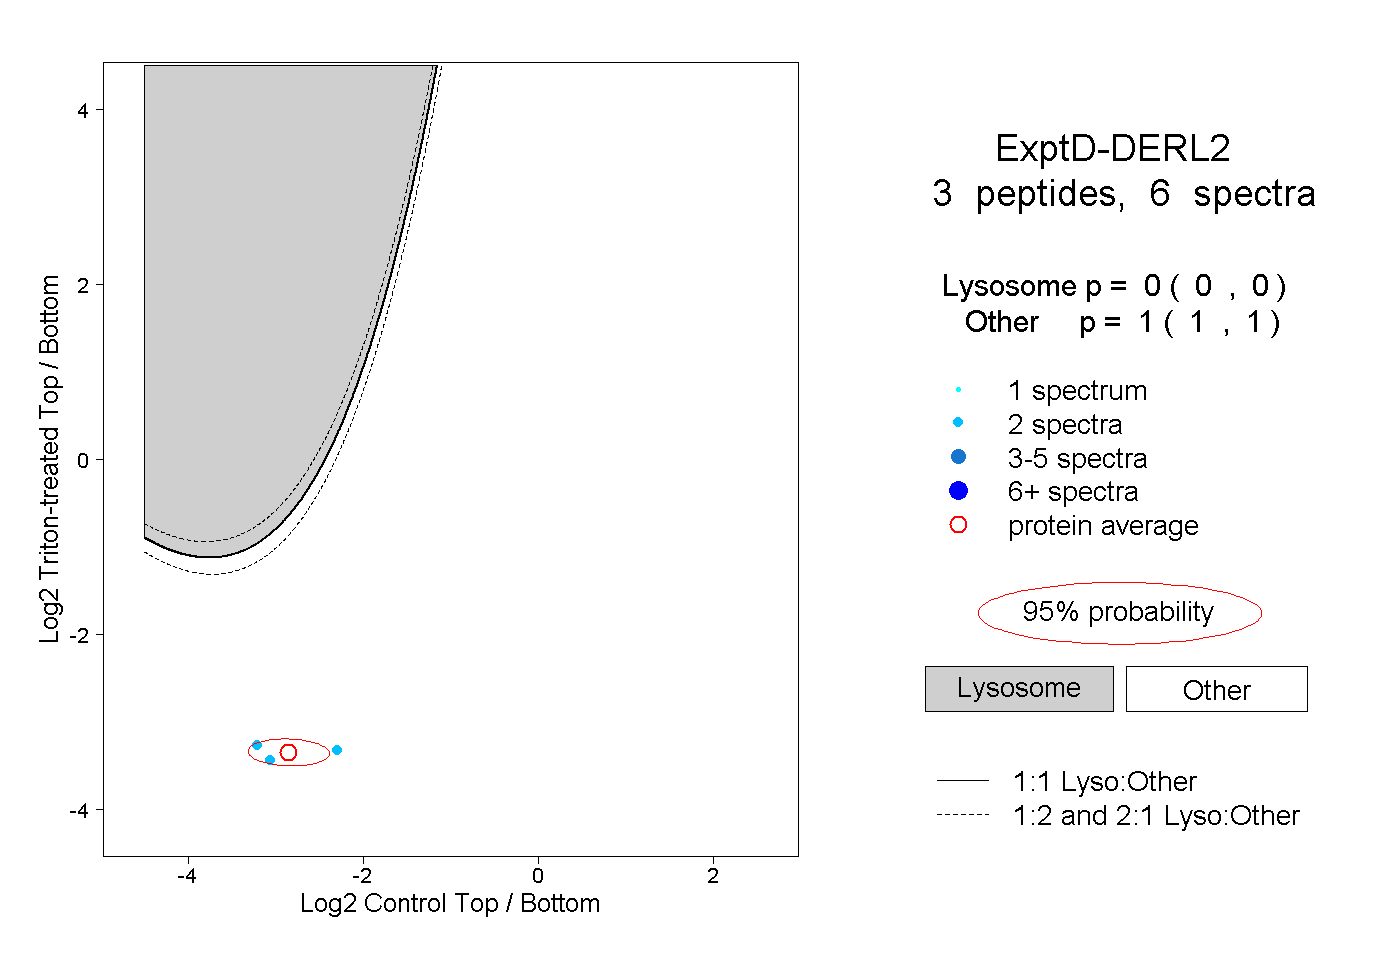
| Expt D |
3
peptides |
6
spectra |
 |
|
0.000
0.000 | 0.000 |
|
|
|
|
|
|
|
1.000
1.000 | 1.000 |