 36
36peptides
spectra
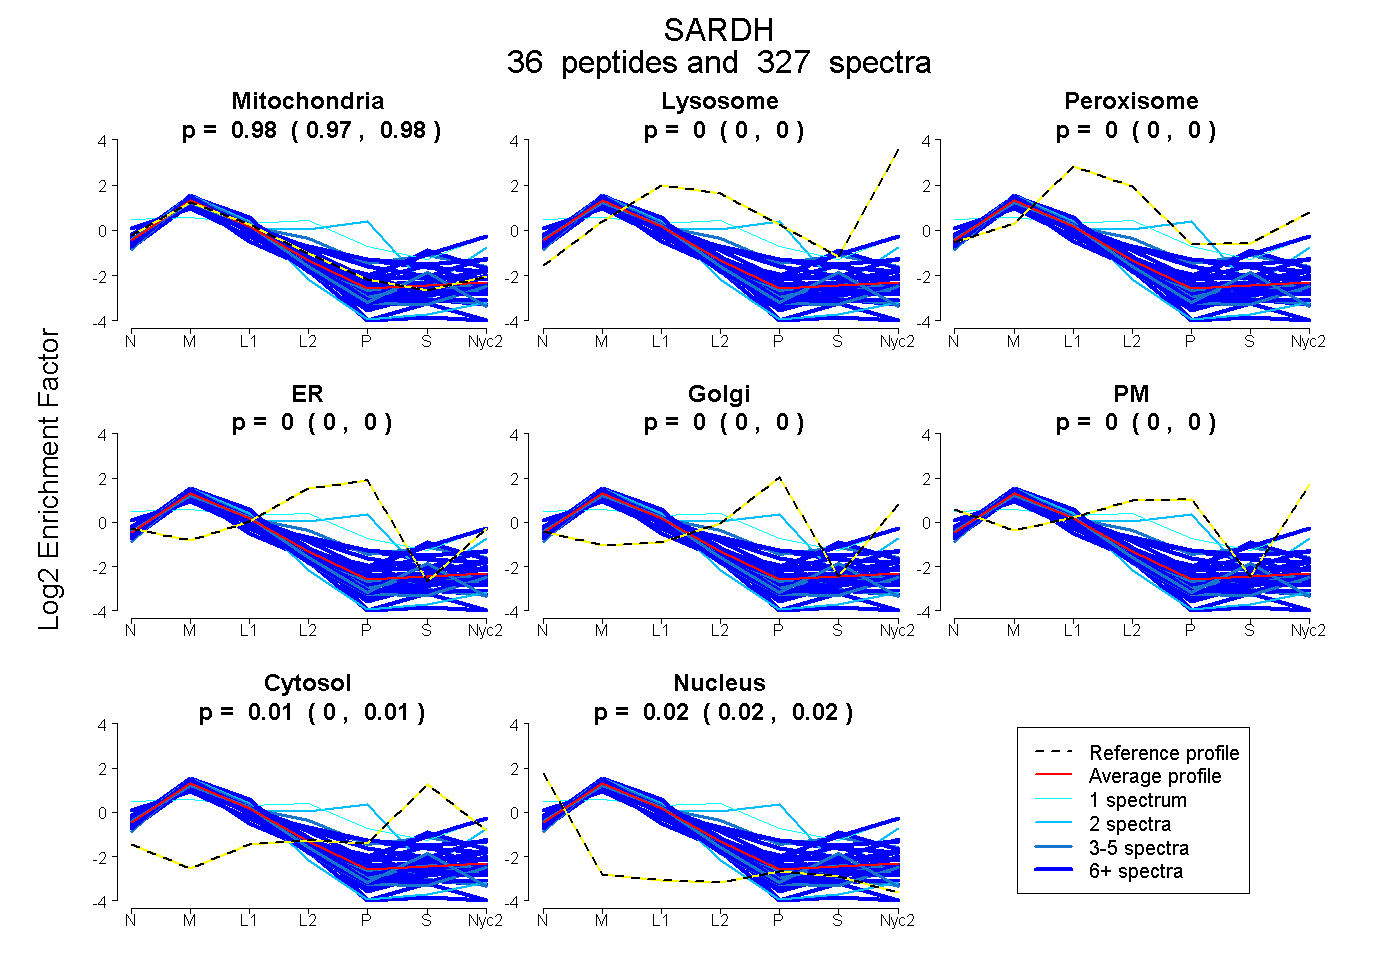
0.975 | 0.977
0.000 | 0.000
0.000 | 0.000
0.000 | 0.000
0.000 | 0.000
0.000 | 0.000
0.003 | 0.007
0.018 | 0.021
32peptides
spectra
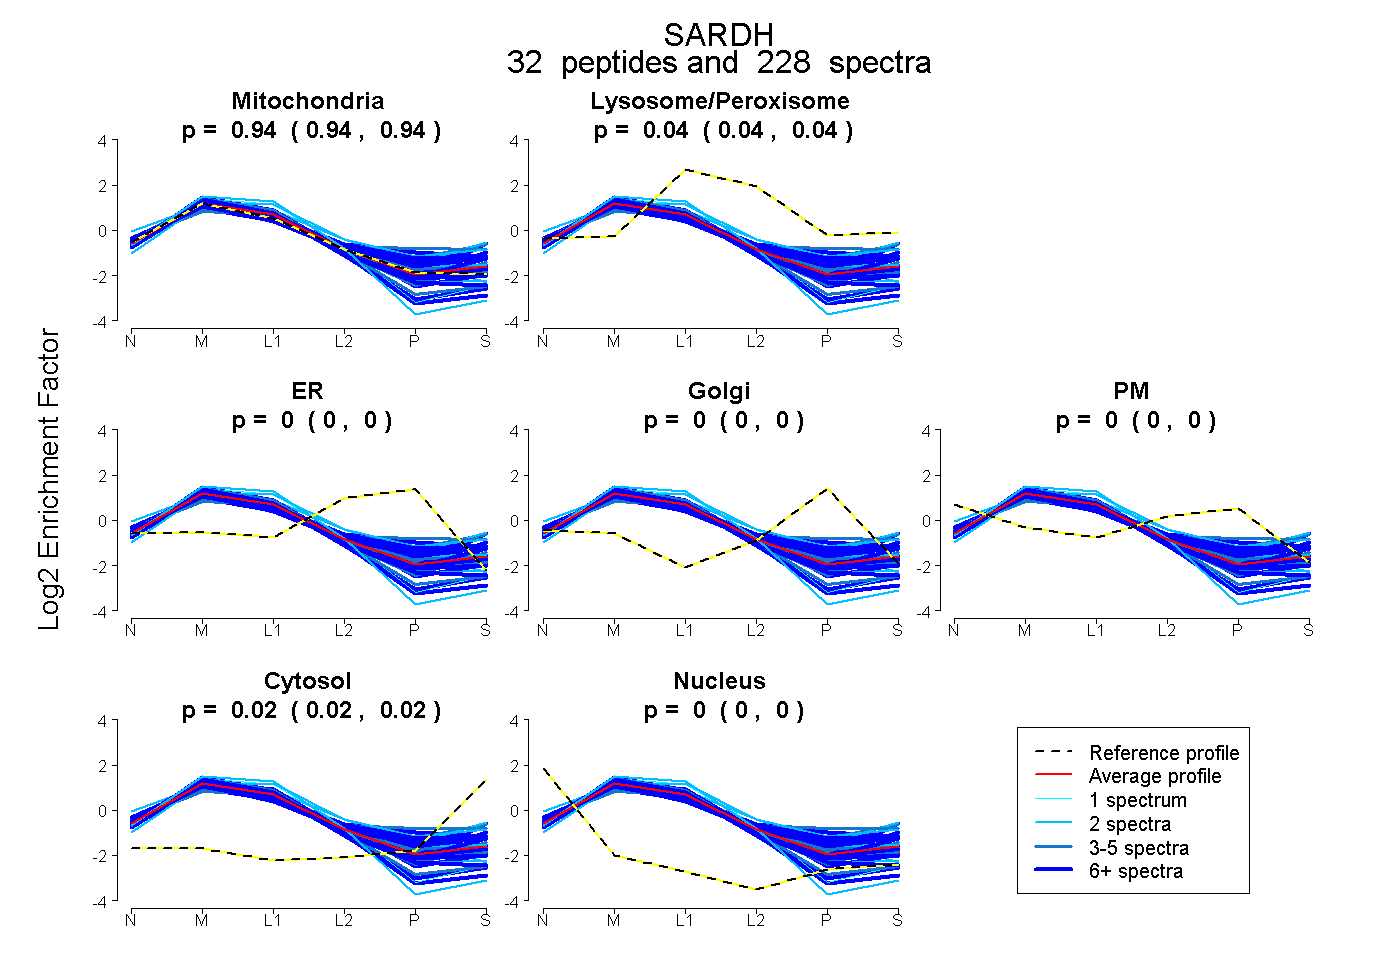
0.938 | 0.944
0.036 | 0.040
0.000 | 0.000
0.000 | 0.000
0.000 | 0.000
0.019 | 0.022
0.000 | 0.000
41peptides
spectra
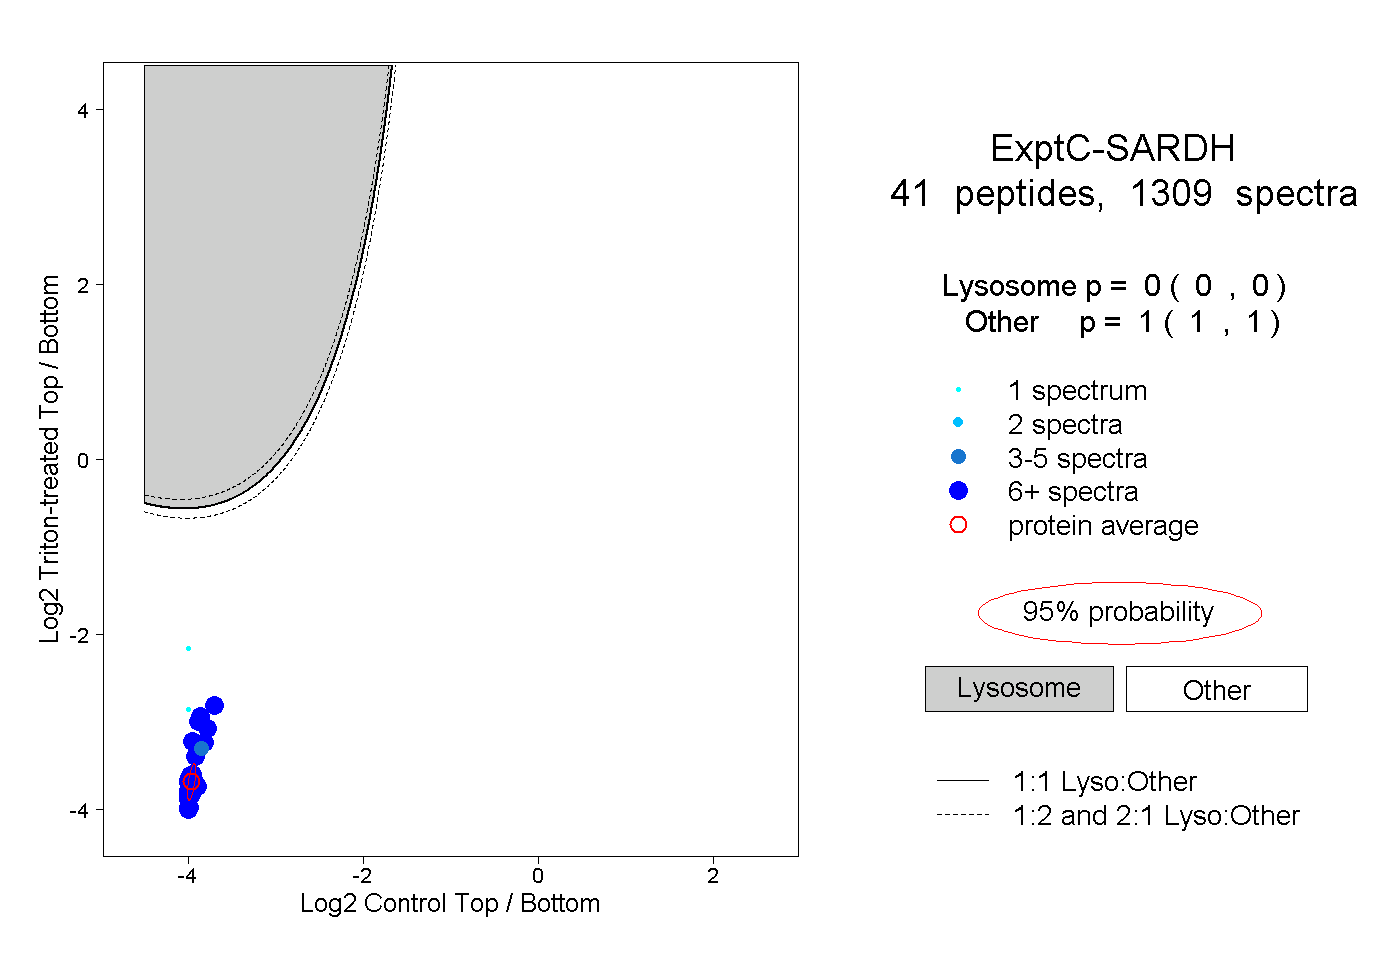
0.000 | 0.000
1.000 | 1.000
29peptides
spectra
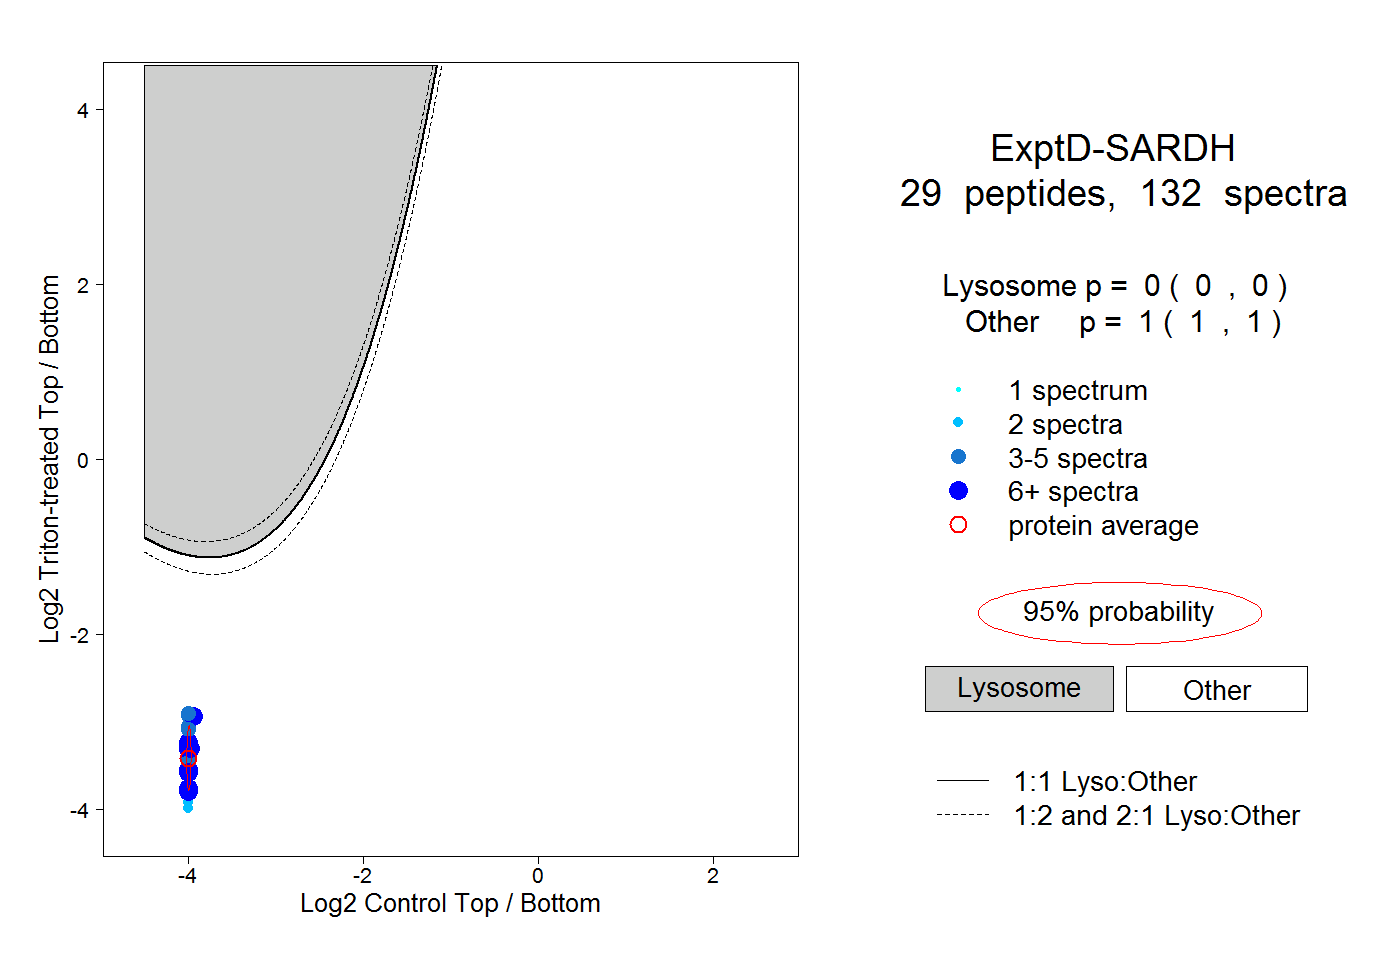
0.000 | 0.000
1.000 | 1.000