 17
17peptides
spectra
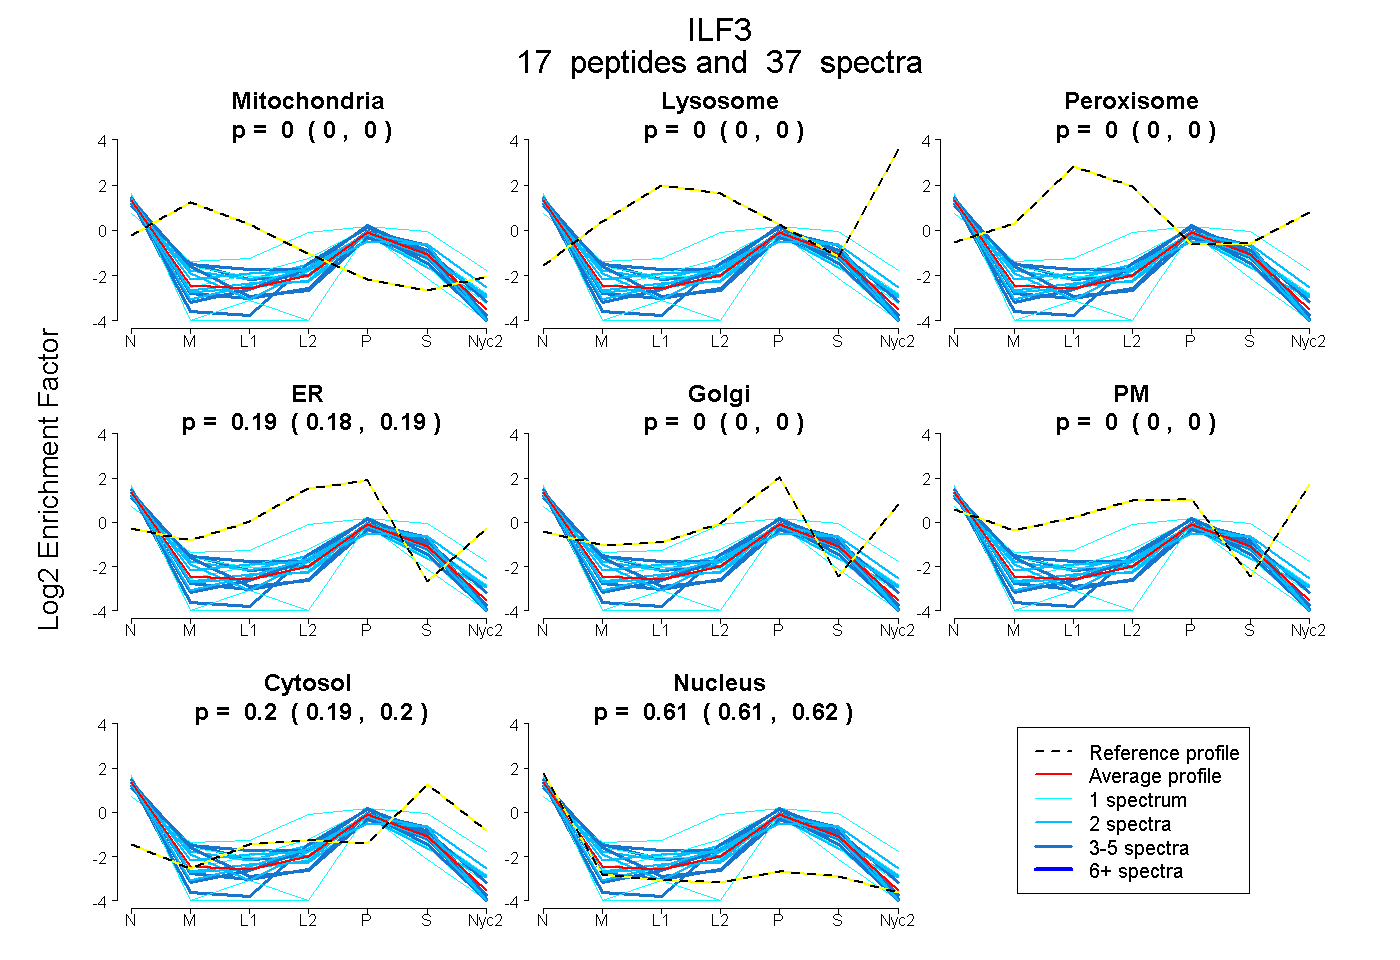
0.000 | 0.000
0.000 | 0.000
0.000 | 0.000
0.182 | 0.194
0.000 | 0.000
0.000 | 0.000
0.192 | 0.202
0.608 | 0.619
6peptides
spectra
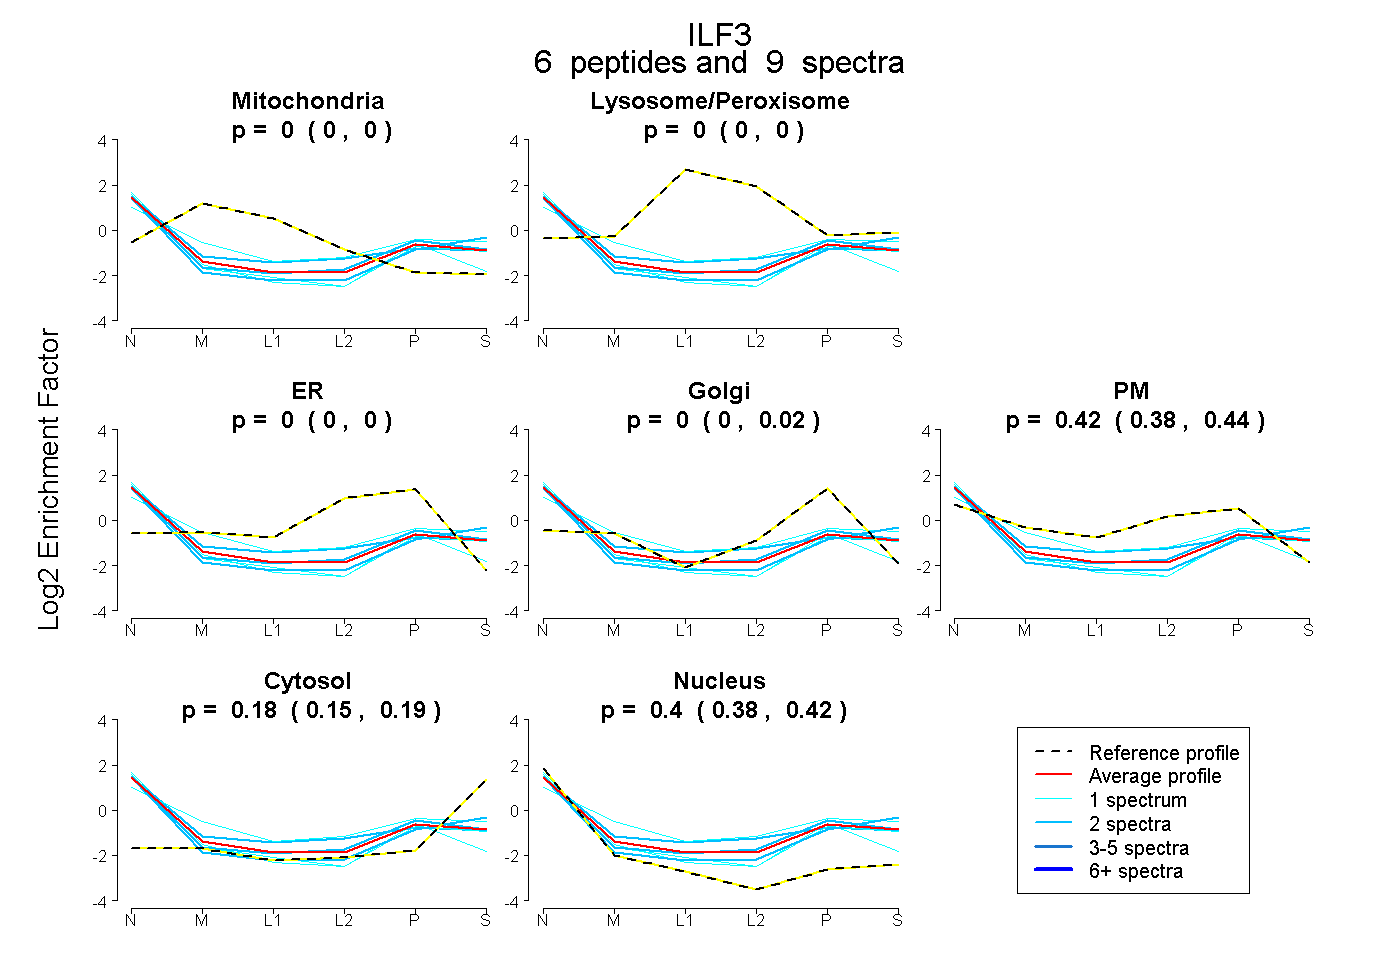
0.000 | 0.000
0.000 | 0.000
0.000 | 0.000
0.000 | 0.023
0.383 | 0.443
0.151 | 0.195
0.379 | 0.423
5peptides
spectra
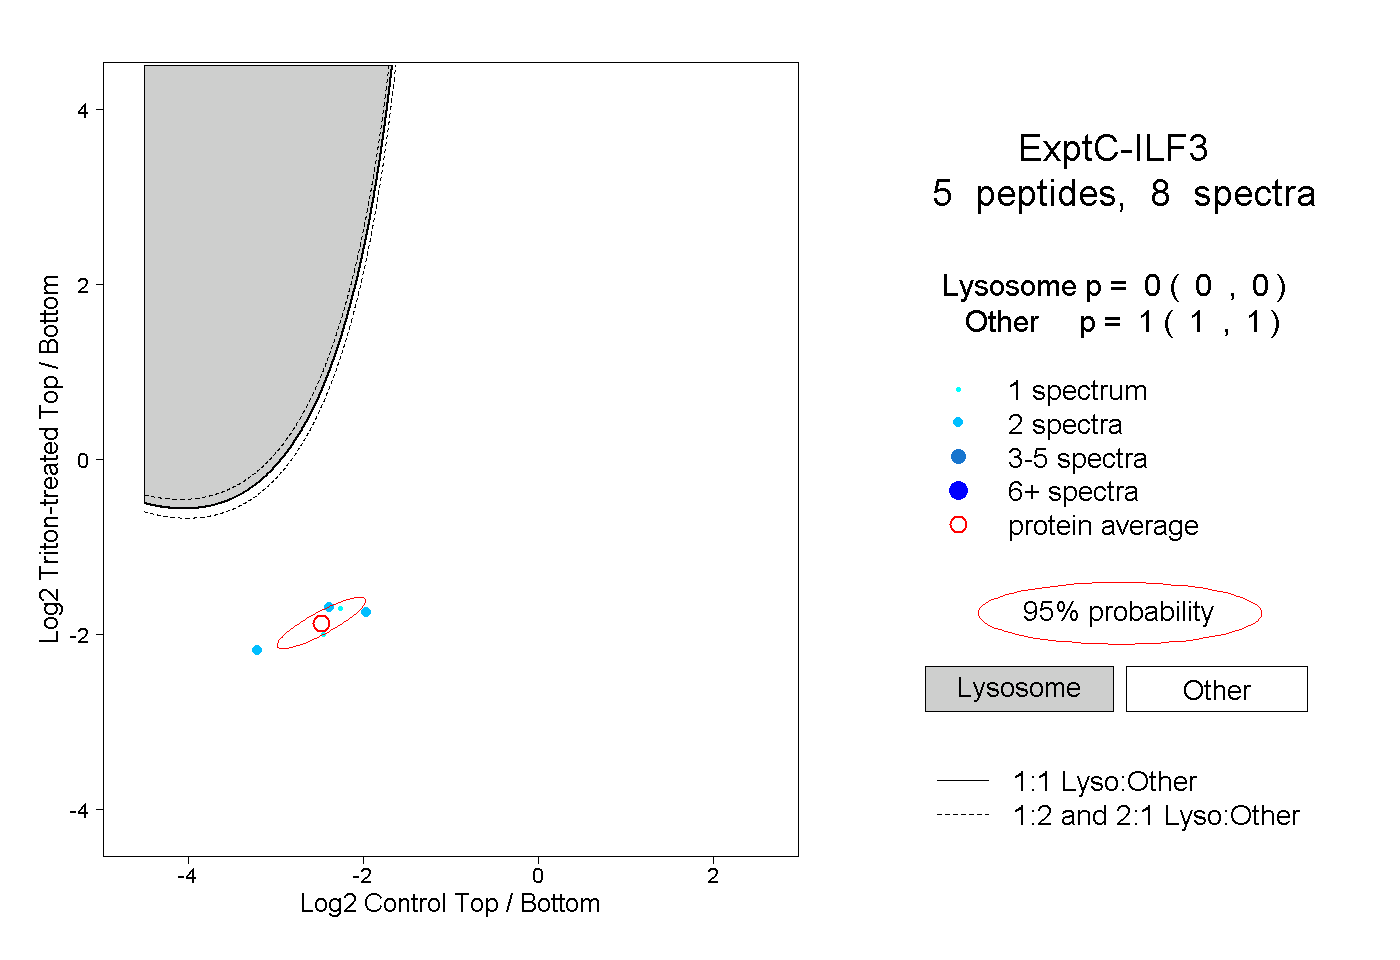
0.000 | 0.000
1.000 | 1.000
2peptides
spectra
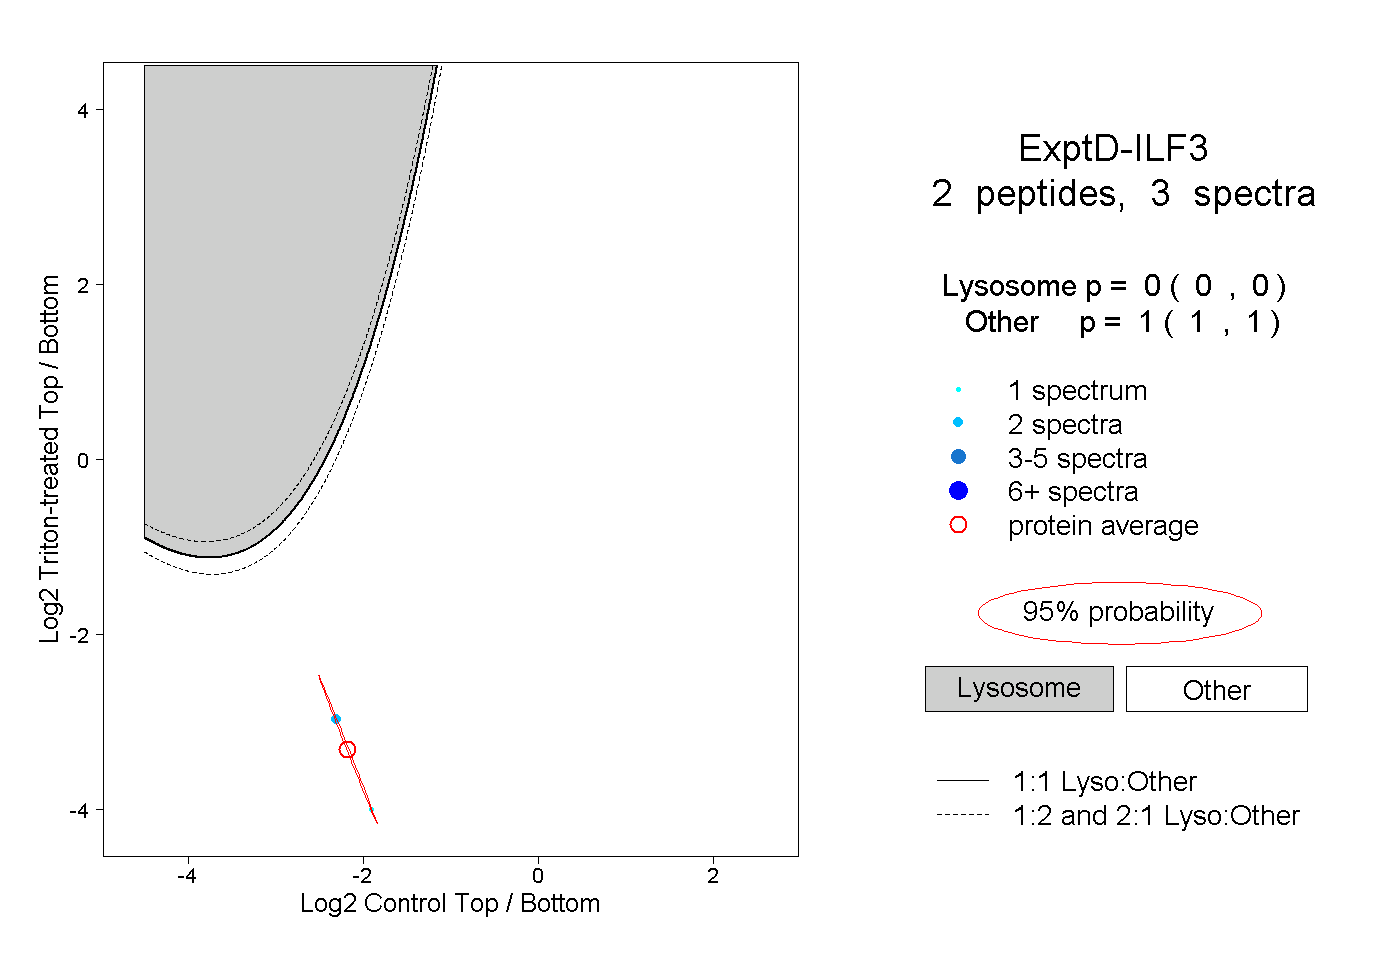
0.000 | 0.000
1.000 | 1.000