ILF3
[ENSRNOP00000009354]
Main page
| | | Plot |
Mito |
Lyso |
|
Perox |
ER |
Golgi |
PM |
Cytosol |
Nucleus |
|
| Expt A |
 17
17
peptides |
37
spectra |
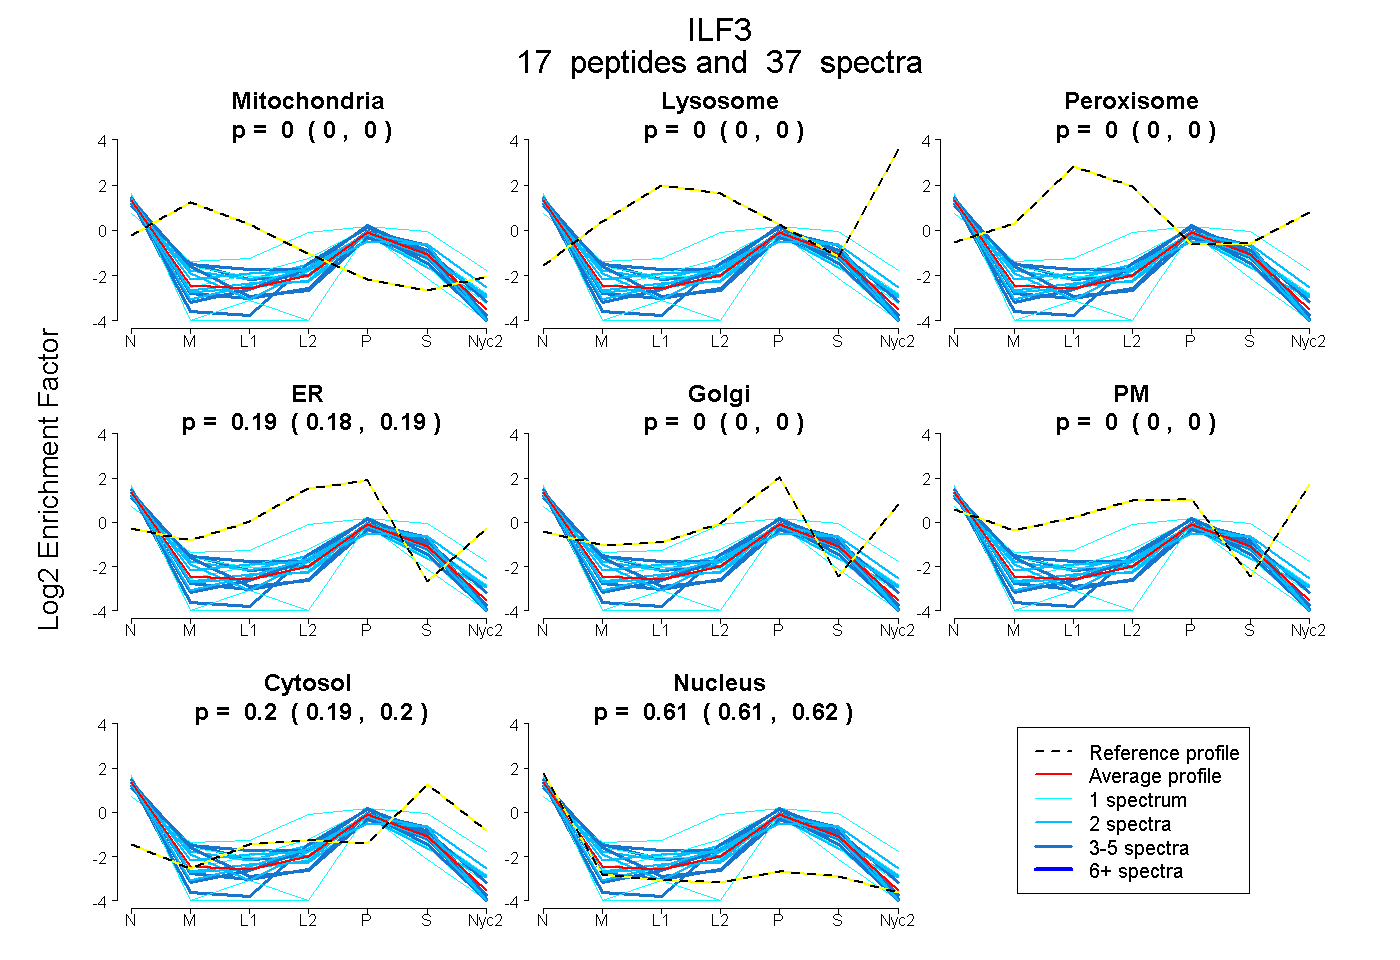 |
0.000
0.000 | 0.000 |
0.000
0.000 | 0.000 |
|
0.000
0.000 | 0.000 |
0.189
0.182 | 0.194 |
0.000
0.000 | 0.000 |
0.000
0.000 | 0.000 |
0.197
0.192 | 0.202 |
0.614
0.608 | 0.619 |
|
| | | Plot |
Mito |
|
Lyso or Perox |
|
ER |
Golgi |
PM |
Cytosol |
Nucleus |
|
| Expt B |
6
peptides |
9
spectra |
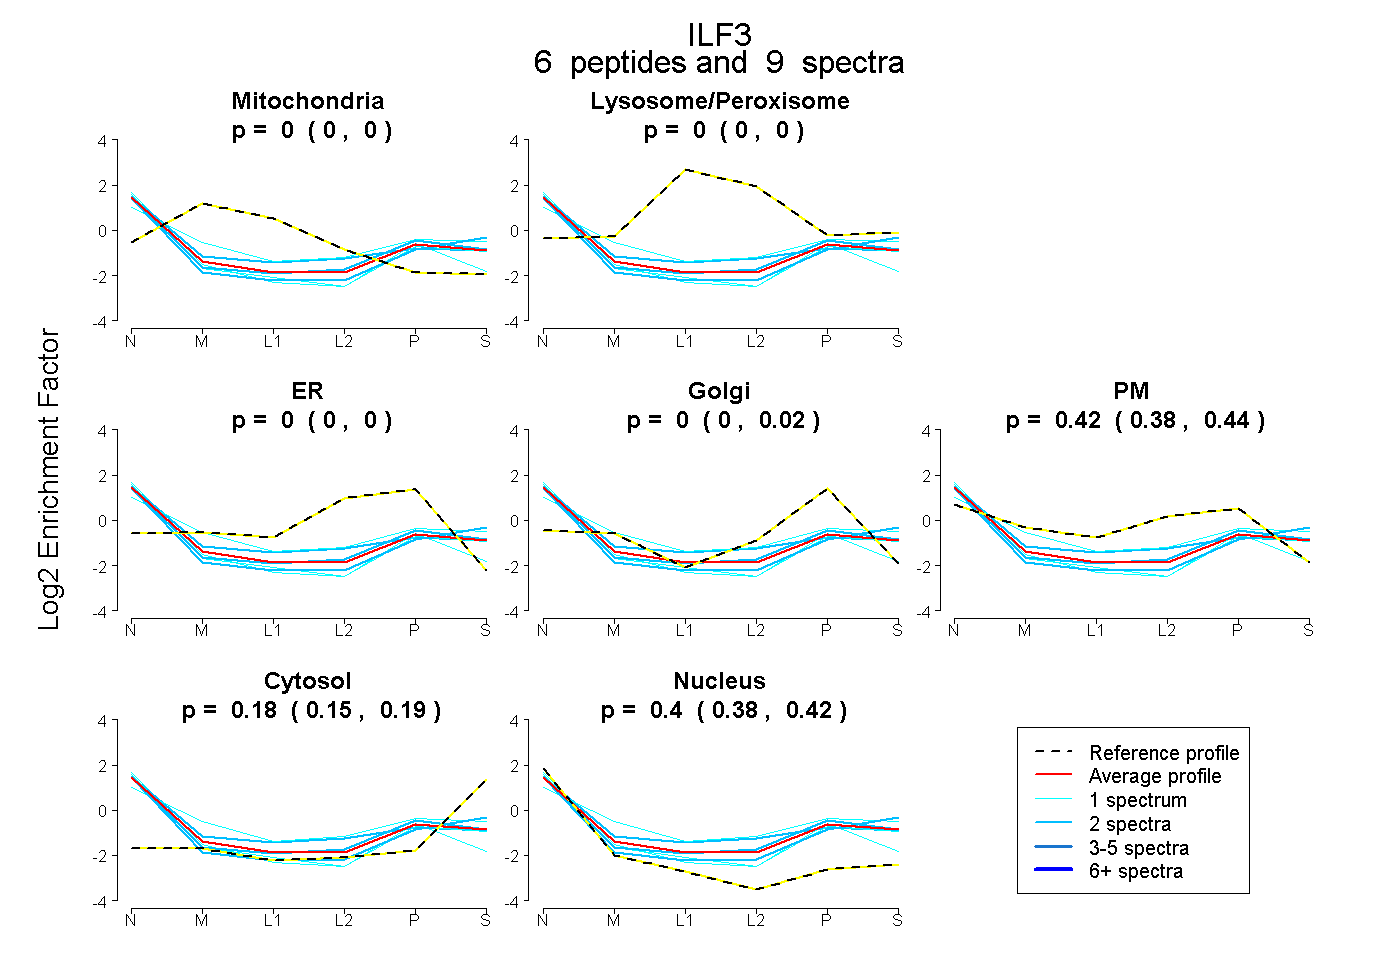 |
0.000
0.000 | 0.000 |
|
0.000
0.000 | 0.000 |
|
0.000
0.000 | 0.000 |
0.000
0.000 | 0.023 |
0.423
0.383 | 0.443 |
0.175
0.151 | 0.195 |
0.402
0.379 | 0.423 |
|
| 2 spectra, LAAFGQLHK |
0.000 |
|
0.000 |
|
0.000 |
0.017 |
0.434 |
0.172 |
0.377 |
|
| 2 spectra, CLAALASLR |
0.000 |
|
0.094 |
|
0.000 |
0.000 |
0.415 |
0.116 |
0.375 |
|
| 1 spectrum, EATDAIGHLDR |
0.000 |
|
0.019 |
|
0.000 |
0.000 |
0.574 |
0.236 |
0.171 |
|
| 2 spectra, SCVIVLR |
0.000 |
|
0.000 |
|
0.000 |
0.000 |
0.269 |
0.295 |
0.435 |
|
| 1 spectrum, AYAALAALEK |
0.000 |
|
0.000 |
|
0.000 |
0.284 |
0.126 |
0.000 |
0.590 |
|
| 1 spectrum, GWPLELICEK |
0.000 |
|
0.000 |
|
0.000 |
0.091 |
0.239 |
0.157 |
0.513 |
|
| | | Plot |
|
Lyso |
|
|
|
|
|
|
|
Other |
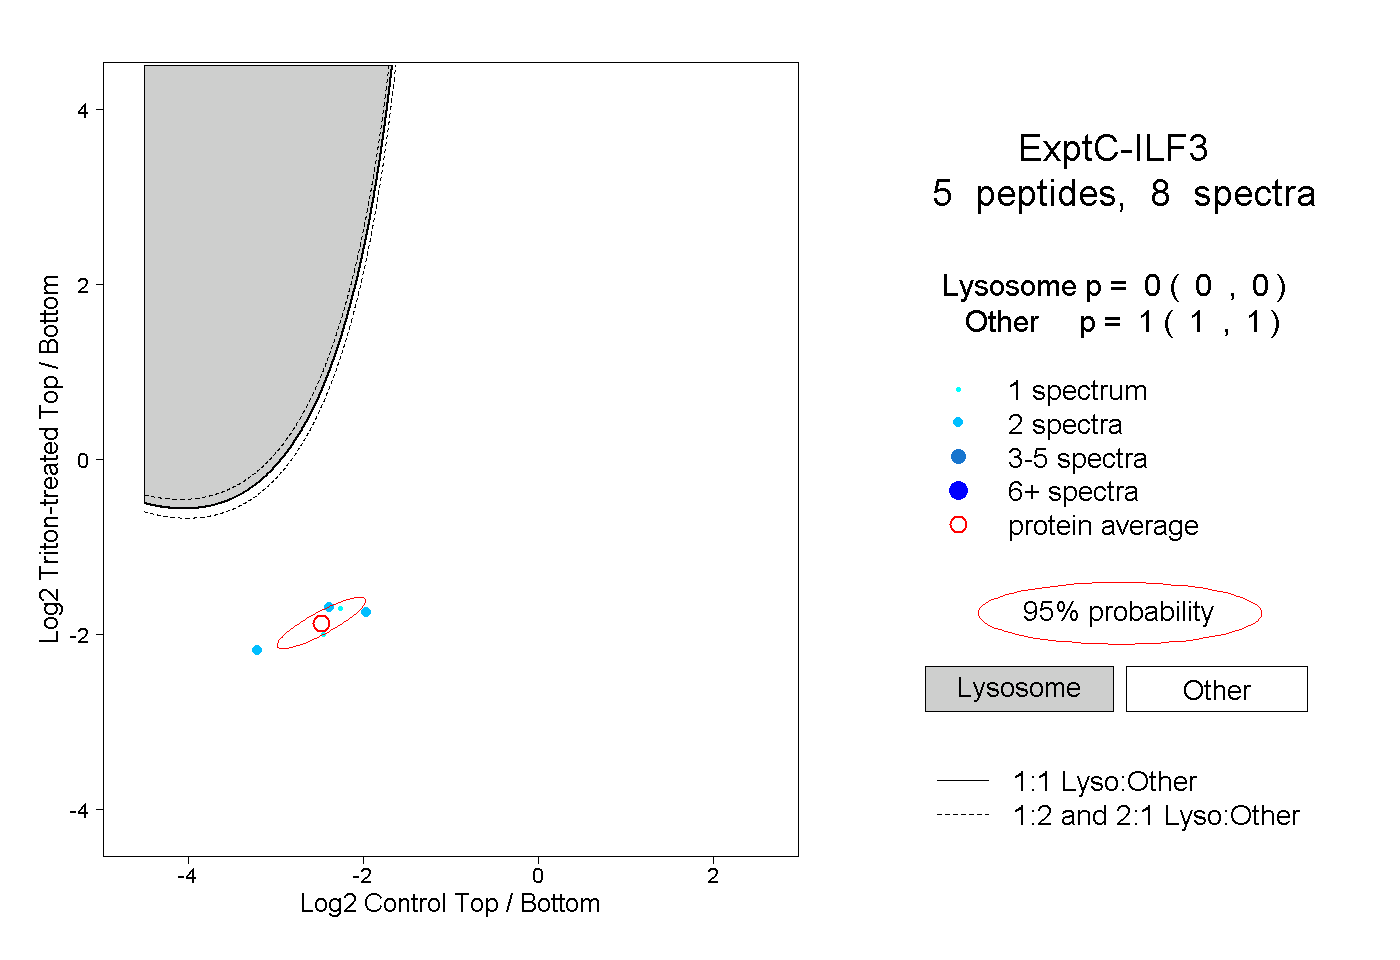
| Expt C |
5
peptides |
8
spectra |
 |
|
0.000
0.000 | 0.000 |
|
|
|
|
|
|
|
1.000
1.000 | 1.000 |
| | | Plot |
|
Lyso |
|
|
|
|
|
|
|
Other |
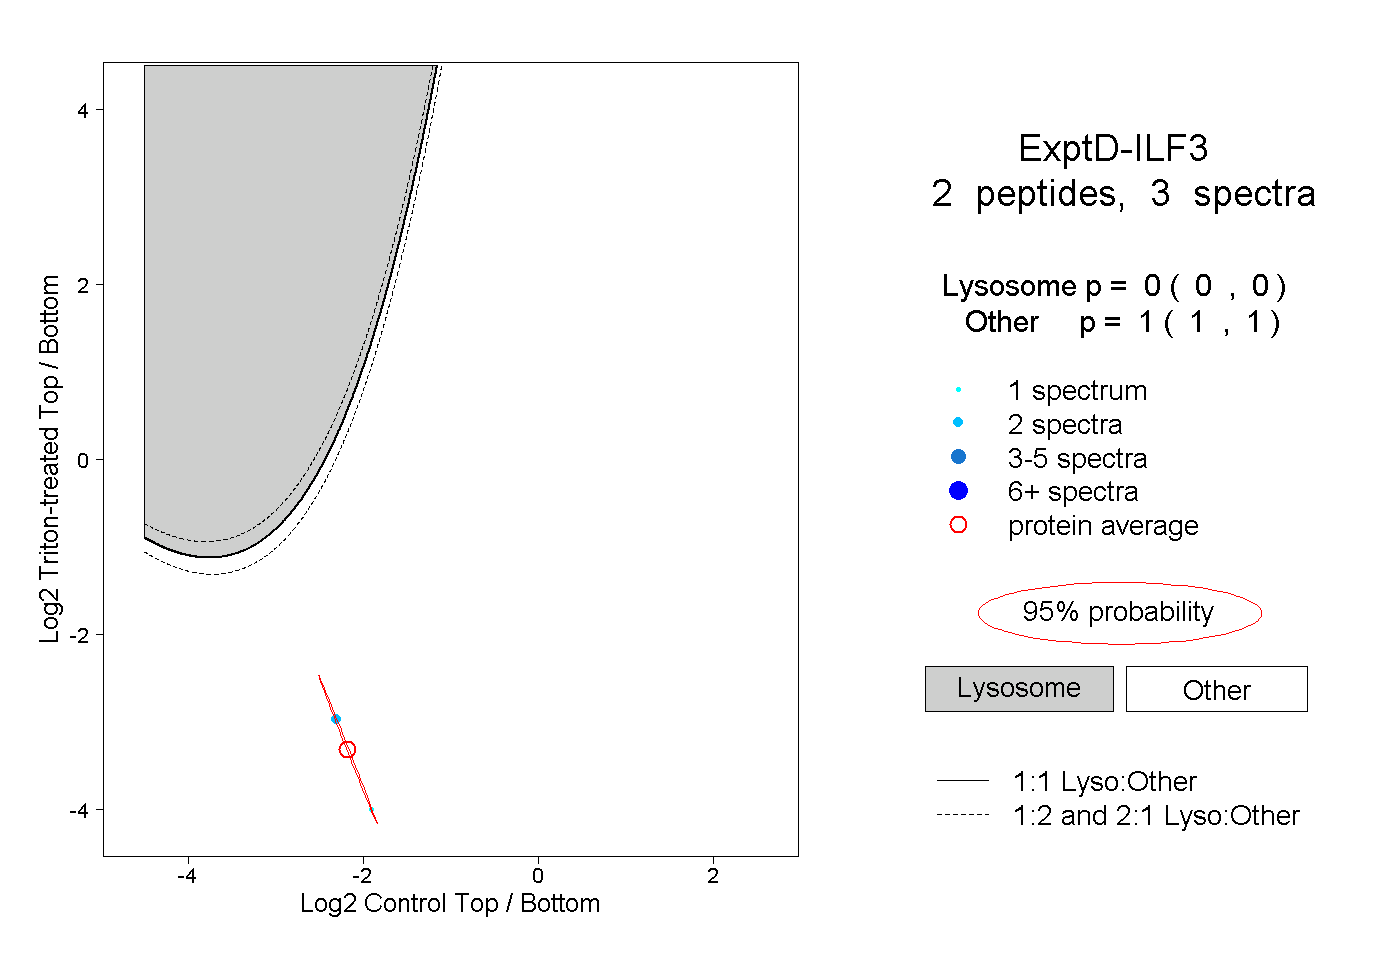
| Expt D |
2
peptides |
3
spectra |
 |
|
0.000
0.000 | 0.000 |
|
|
|
|
|
|
|
1.000
1.000 | 1.000 |