 8
8peptides
spectra
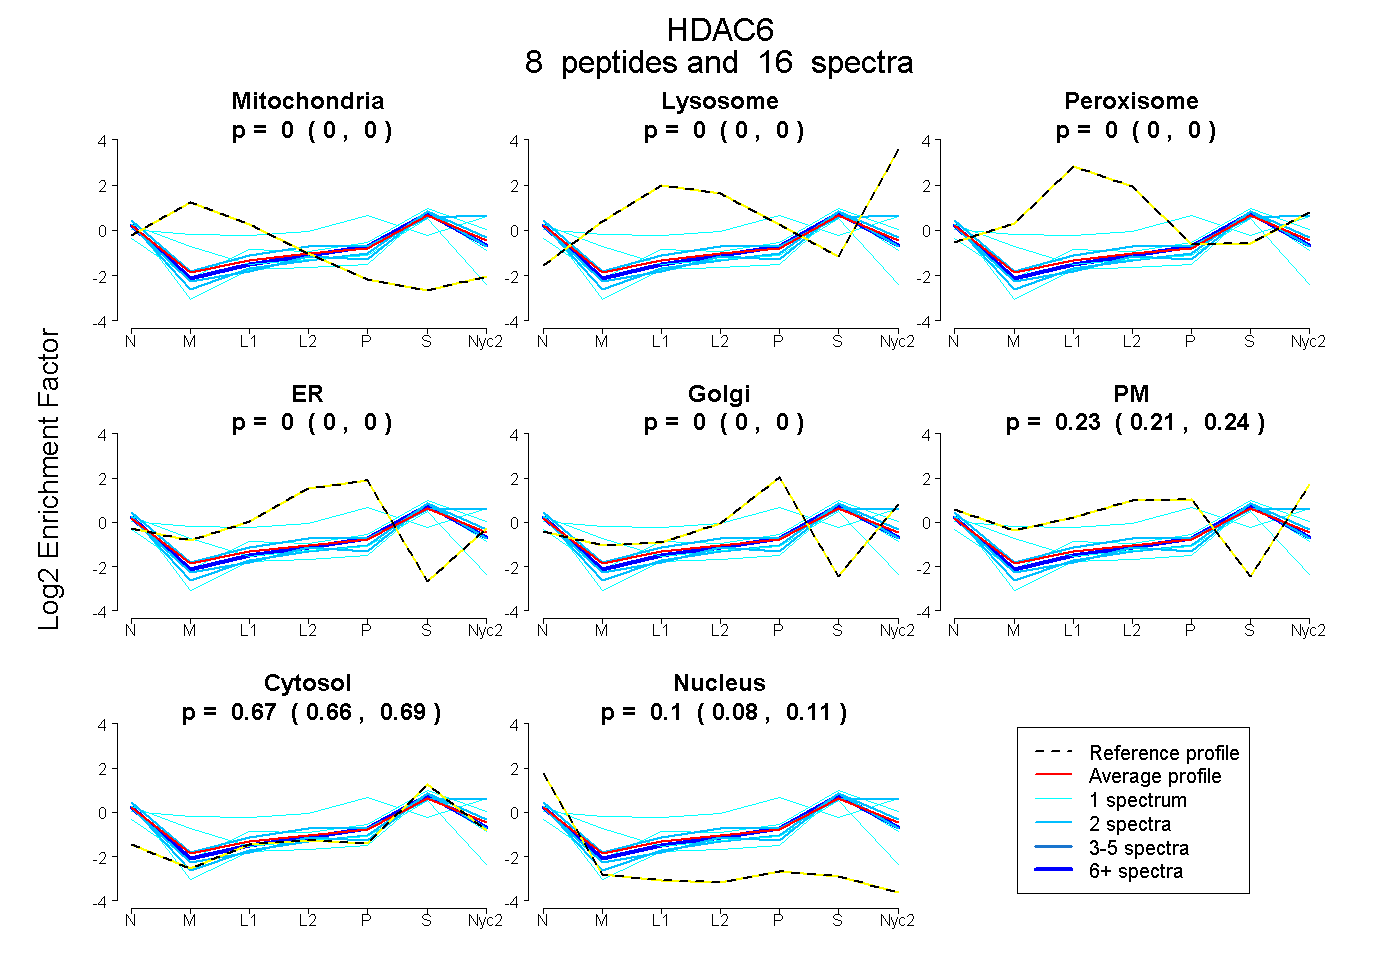
0.000 | 0.000
0.000 | 0.000
0.000 | 0.002
0.000 | 0.000
0.000 | 0.000
0.211 | 0.243
0.661 | 0.687
0.081 | 0.111
3peptides
spectra

0.000 | 0.287
0.000 | 0.366
0.000 | 0.000
0.000 | 0.045
0.000 | 0.449
0.300 | 0.543
0.000 | 0.332
6peptides
spectra
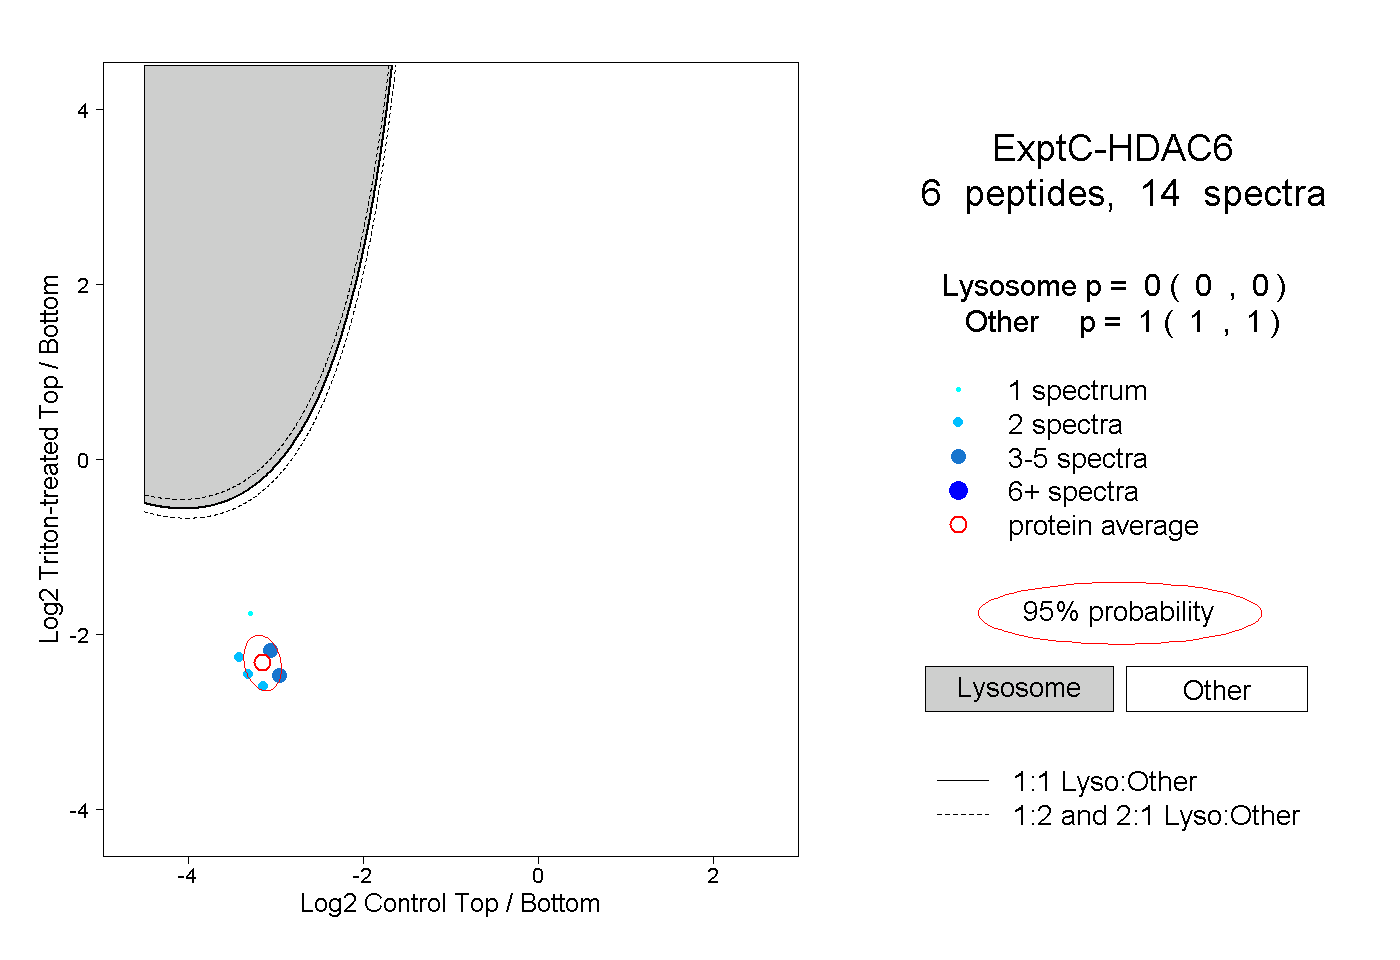
0.000 | 0.000
1.000 | 1.000