 8
8peptides
spectra
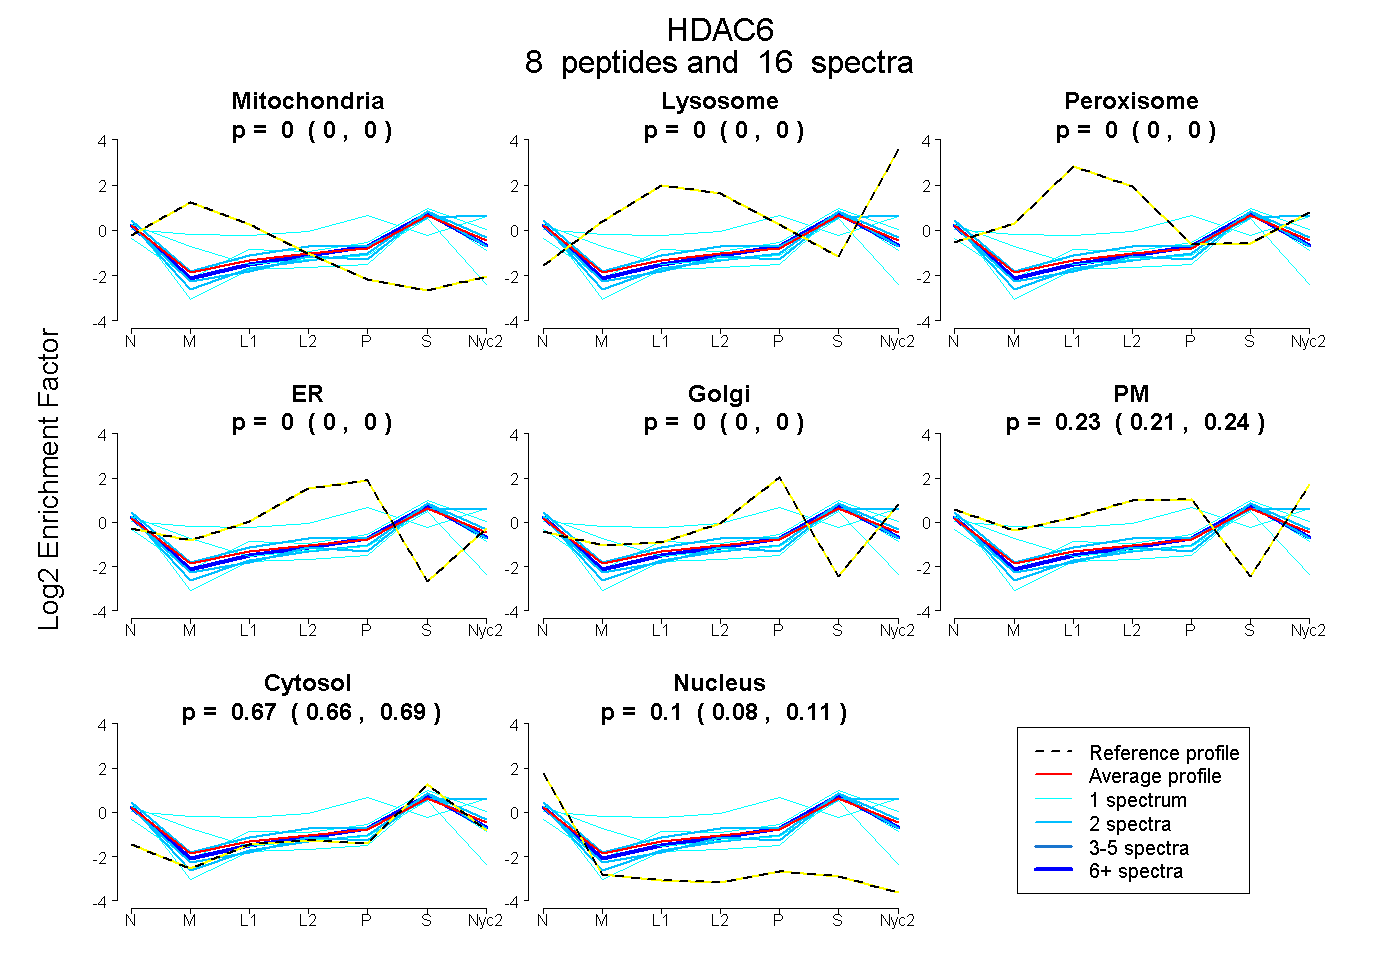
0.000 | 0.000
0.000 | 0.000
0.000 | 0.002
0.000 | 0.000
0.000 | 0.000
0.211 | 0.243
0.661 | 0.687
0.081 | 0.111
| Plot | Mito | Lyso | Perox | ER | Golgi | PM | Cytosol | Nucleus | |||||
| Expt A |
8 peptides |
16 spectra |
|
0.000 0.000 | 0.000 |
0.000 0.000 | 0.000 |
0.000 0.000 | 0.002 |
0.000 0.000 | 0.000 |
0.000 0.000 | 0.000 |
0.228 0.211 | 0.243 |
0.675 0.661 | 0.687 |
0.097 0.081 | 0.111 |
| 1 spectrum, IMCHLEEVGLAAR | 0.274 | 0.000 | 0.000 | 0.016 | 0.000 | 0.000 | 0.560 | 0.151 | ||
| 2 spectra, LVDAVMGAEIR | 0.000 | 0.000 | 0.000 | 0.000 | 0.000 | 0.145 | 0.737 | 0.118 | ||
| 1 spectrum, ALLAQGQSSEQAAK | 0.000 | 0.000 | 0.003 | 0.000 | 0.000 | 0.235 | 0.762 | 0.000 | ||
| 2 spectra, HAQVIAGR | 0.000 | 0.000 | 0.000 | 0.000 | 0.000 | 0.110 | 0.741 | 0.149 | ||
| 1 spectrum, EQLILEGLLGR | 0.000 | 0.000 | 0.000 | 0.000 | 0.000 | 0.038 | 0.749 | 0.213 | ||
| 1 spectrum, AAGTGFTVNVPWNGPR | 0.000 | 0.000 | 0.167 | 0.000 | 0.175 | 0.349 | 0.309 | 0.000 | ||
| 6 spectra, FWPHLK | 0.000 | 0.000 | 0.000 | 0.000 | 0.000 | 0.185 | 0.699 | 0.116 | ||
| 2 spectra, TGLVYDER | 0.000 | 0.000 | 0.000 | 0.000 | 0.000 | 0.349 | 0.638 | 0.013 |
| Plot | Mito | Lyso or Perox | ER | Golgi | PM | Cytosol | Nucleus | ||||||
| Expt B |
3 peptides |
3 spectra |
 |
0.028 0.000 | 0.287 |
0.190 0.000 | 0.366 |
0.000 0.000 | 0.000 |
0.000 0.000 | 0.045 |
0.123 0.000 | 0.449 |
0.446 0.300 | 0.543 |
0.213 0.000 | 0.332 |
|||
| Plot | Lyso | Other | |||||||||||
| Expt C |
6 peptides |
14 spectra |
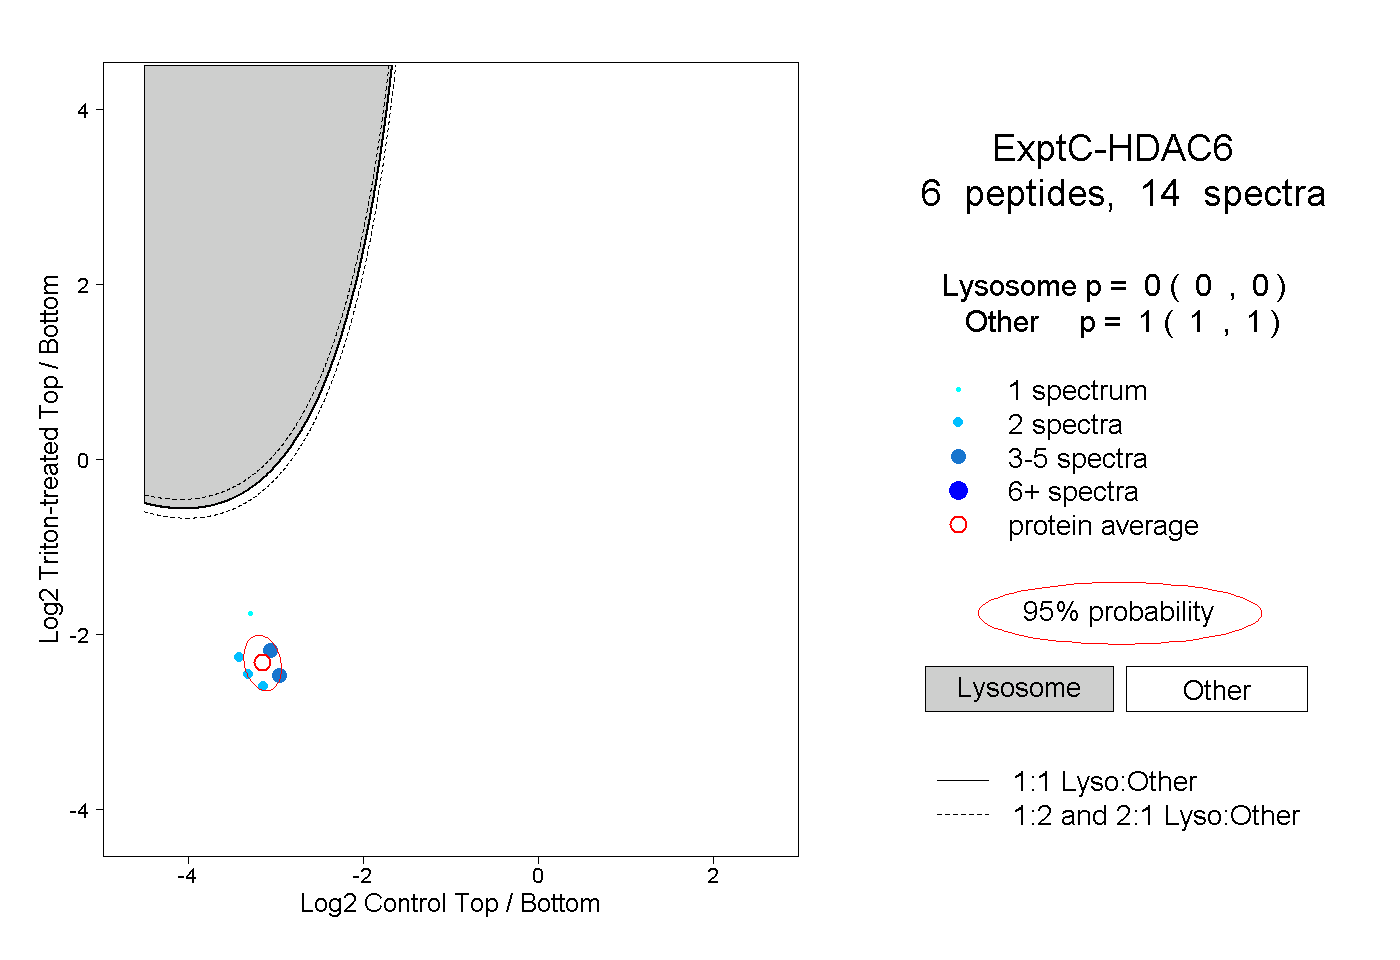 |
0.000 0.000 | 0.000 |
1.000 1.000 | 1.000 |