 5
5peptides
spectra
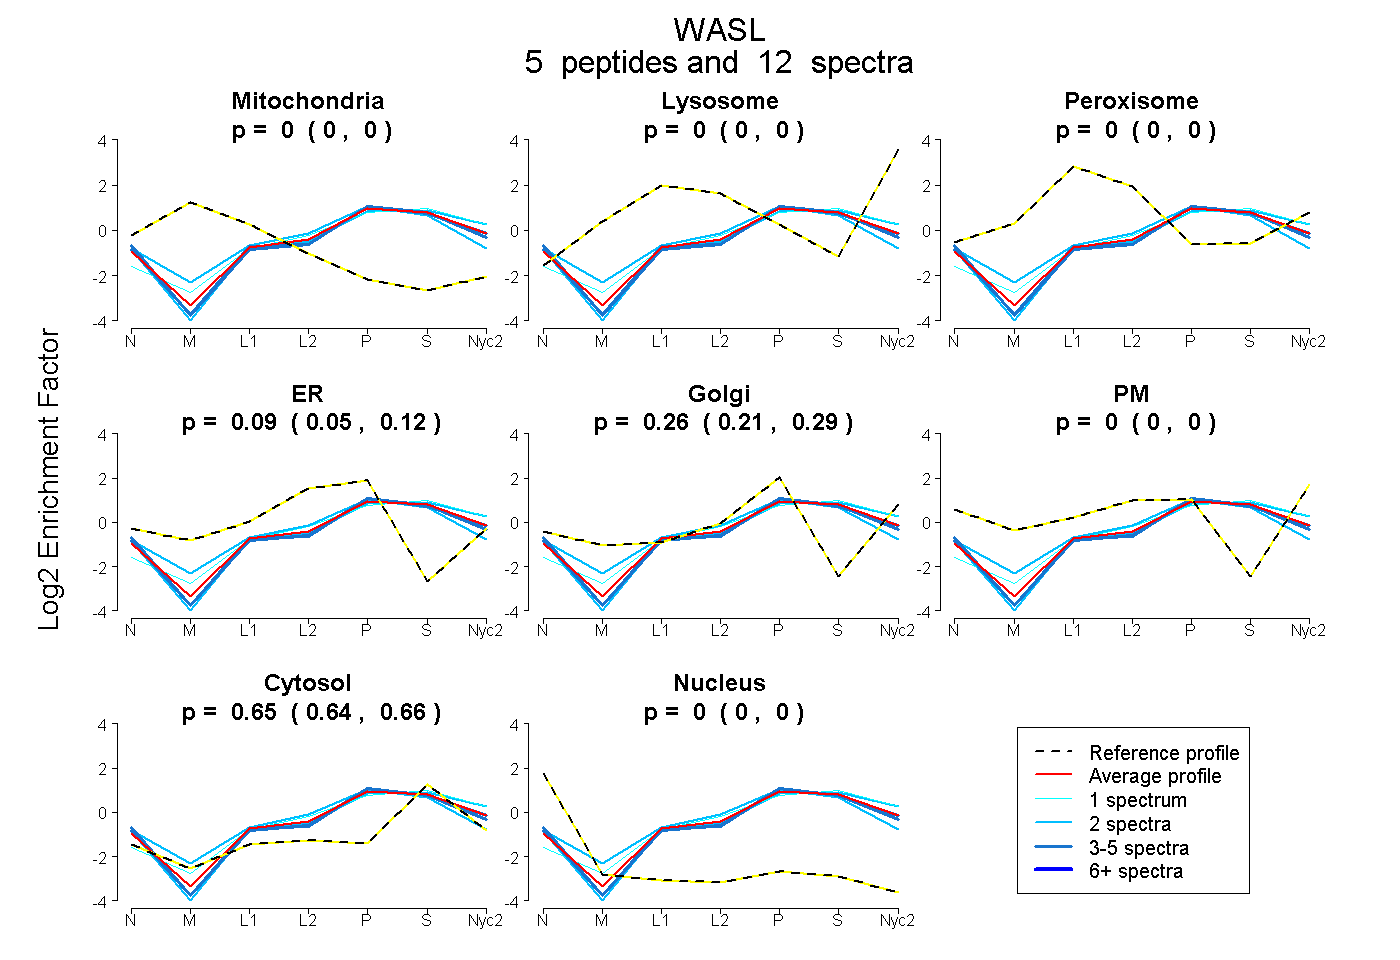
0.000 | 0.000
0.000 | 0.000
0.000 | 0.000
0.053 | 0.117
0.215 | 0.291
0.000 | 0.000
0.642 | 0.665
0.000 | 0.000
6peptides
spectra
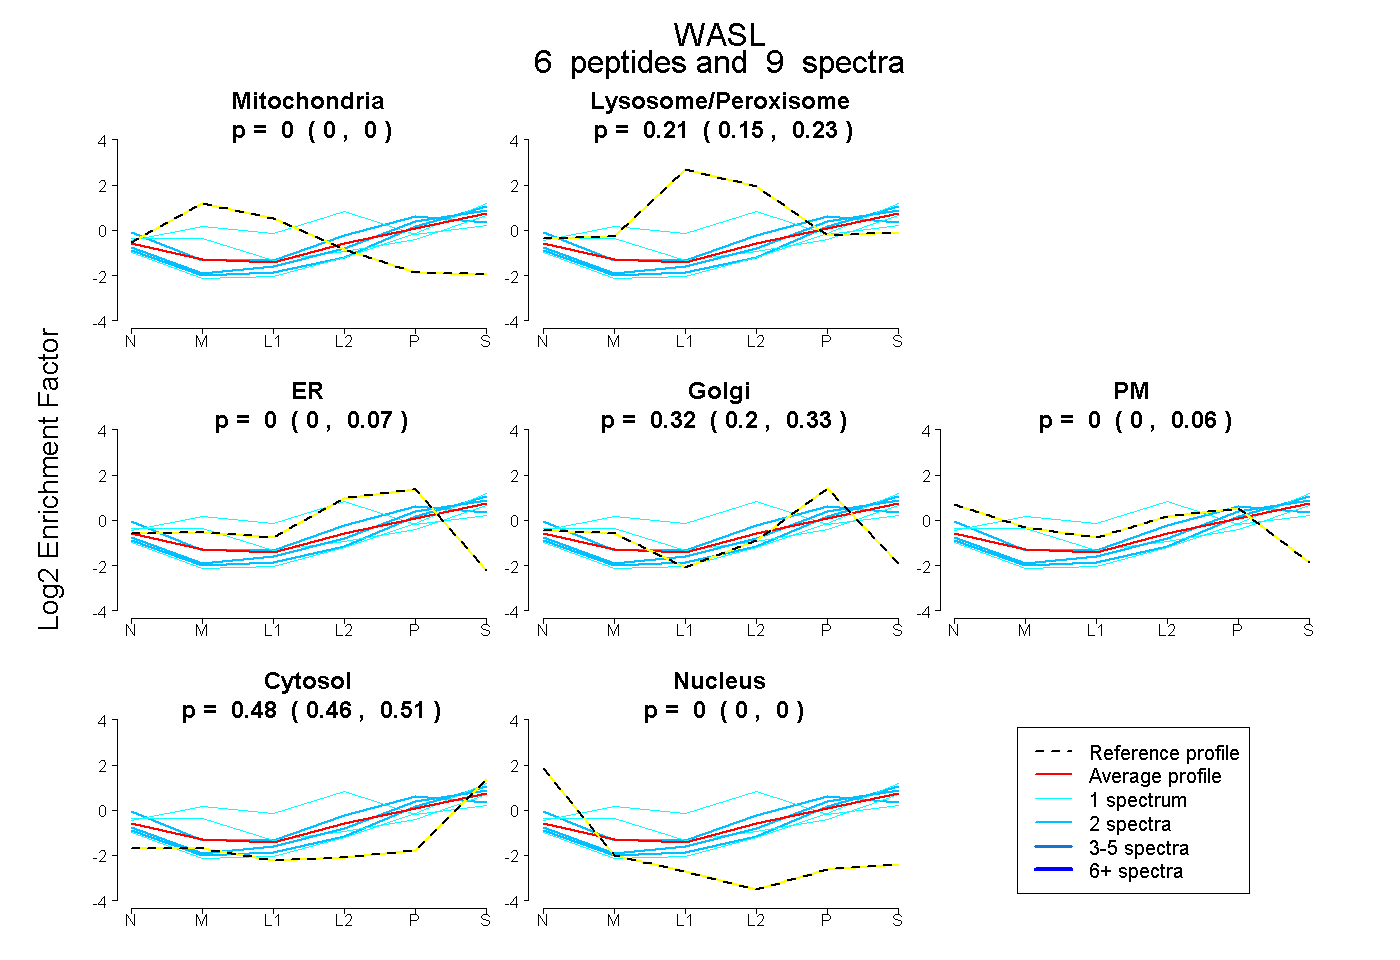
0.000 | 0.000
0.155 | 0.226
0.000 | 0.068
0.204 | 0.334
0.000 | 0.057
0.456 | 0.508
0.000 | 0.000
6peptides
spectra

0.000 | 0.000
1.000 | 1.000
2peptides
spectra

0.000 | 0.000
1.000 | 1.000