 5
5peptides
spectra
0.000 | 0.000
0.000 | 0.000
0.000 | 0.000
0.053 | 0.117
0.215 | 0.291
0.000 | 0.000
0.642 | 0.665
0.000 | 0.000
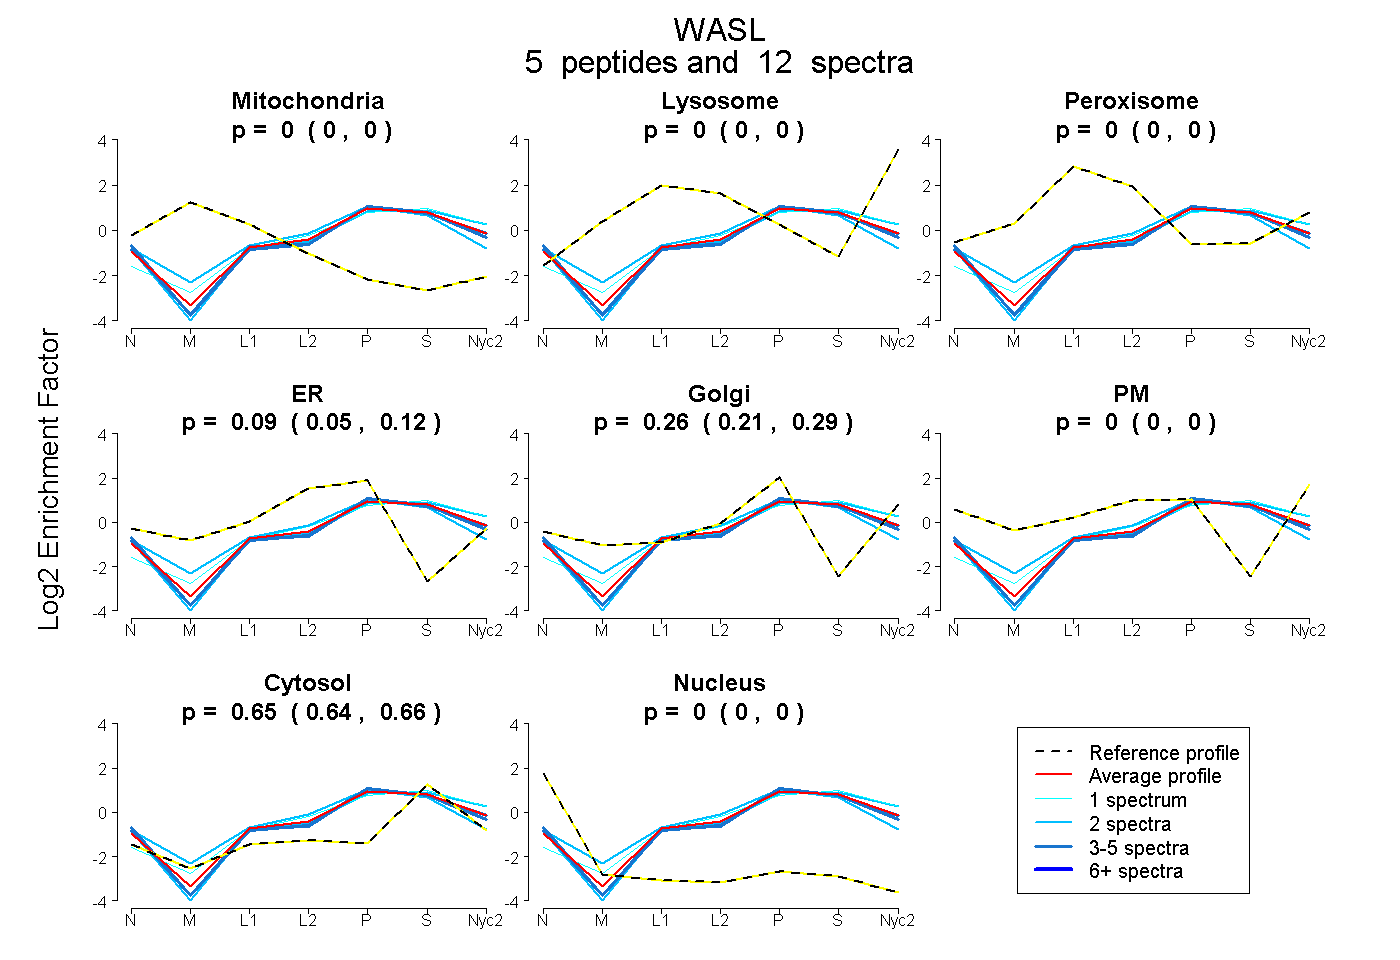
| Plot | Mito | Lyso | Perox | ER | Golgi | PM | Cytosol | Nucleus | |||||
| Expt A |
5 peptides |
12 spectra |
|
0.000 0.000 | 0.000 |
0.000 0.000 | 0.000 |
0.000 0.000 | 0.000 |
0.088 0.053 | 0.117 |
0.258 0.215 | 0.291 |
0.000 0.000 | 0.000 |
0.654 0.642 | 0.665 |
0.000 0.000 | 0.000 |
| 4 spectra, VIYDFIEK | 0.000 | 0.000 | 0.000 | 0.045 | 0.288 | 0.000 | 0.667 | 0.000 | ||
| 2 spectra, NCMWSK | 0.000 | 0.000 | 0.000 | 0.387 | 0.000 | 0.000 | 0.613 | 0.000 | ||
| 3 spectra, QAPPPPPPSR | 0.000 | 0.000 | 0.000 | 0.000 | 0.347 | 0.000 | 0.653 | 0.000 | ||
| 1 spectrum, DALLDQIR | 0.000 | 0.111 | 0.000 | 0.005 | 0.232 | 0.000 | 0.651 | 0.000 | ||
| 2 spectra, AALLDQIR | 0.000 | 0.000 | 0.000 | 0.000 | 0.319 | 0.000 | 0.681 | 0.000 |
| Plot | Mito | Lyso or Perox | ER | Golgi | PM | Cytosol | Nucleus | ||||||
| Expt B |
6 peptides |
9 spectra |
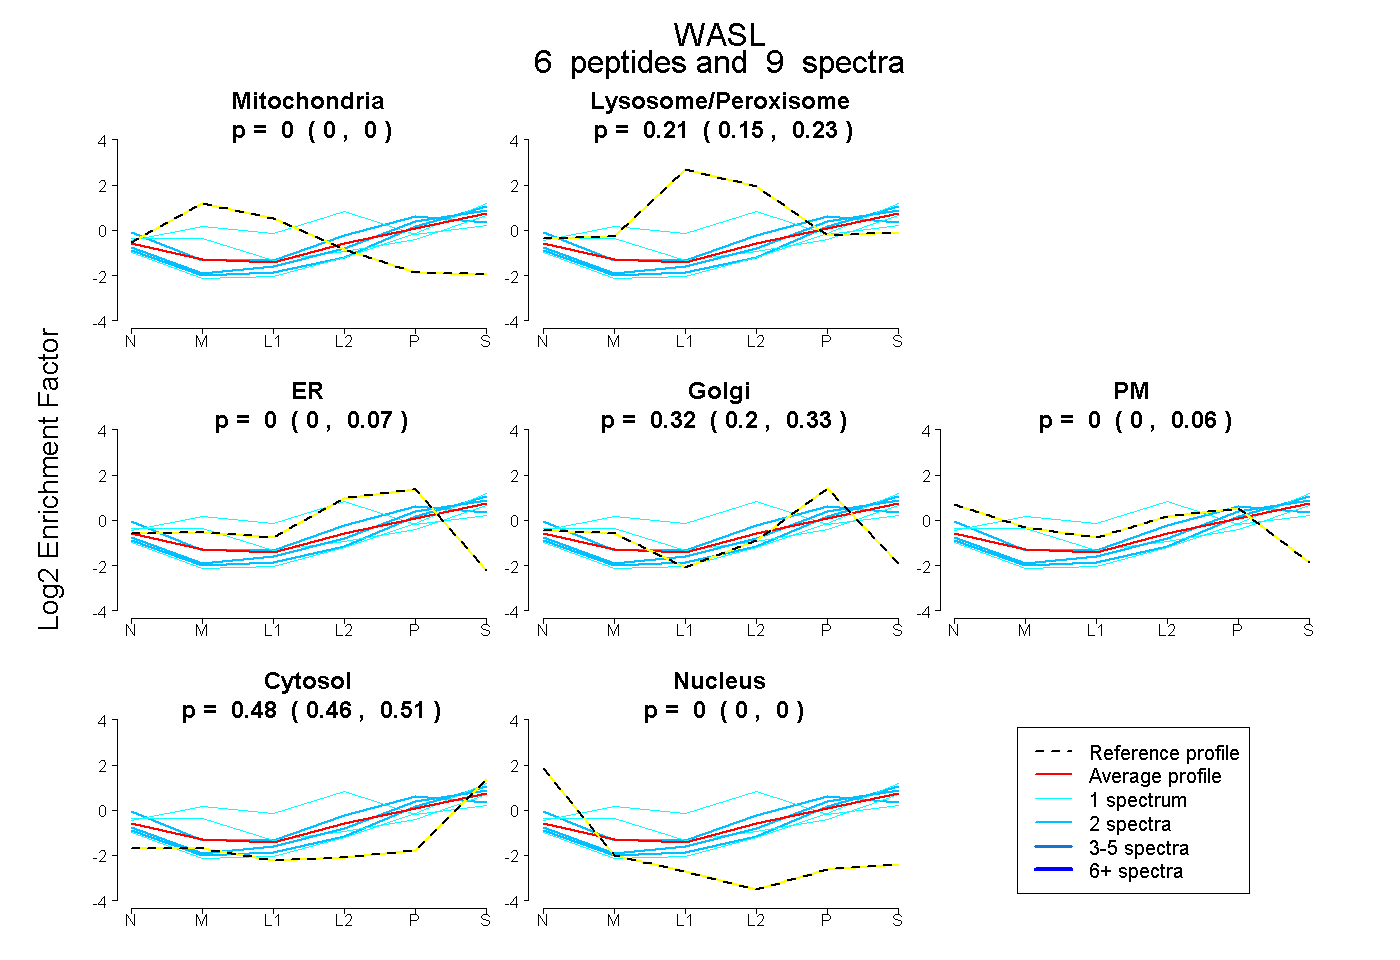 |
0.000 0.000 | 0.000 |
0.206 0.155 | 0.226 |
0.000 0.000 | 0.068 |
0.315 0.204 | 0.334 |
0.000 0.000 | 0.057 |
0.479 0.456 | 0.508 |
0.000 0.000 | 0.000 |
|||
| Plot | Lyso | Other | |||||||||||
| Expt C |
6 peptides |
14 spectra |
 |
0.000 0.000 | 0.000 |
1.000 1.000 | 1.000 |
||||||||
| Plot | Lyso | Other | |||||||||||
| Expt D |
2 peptides |
3 spectra |
 |
0.000 0.000 | 0.000 |
1.000 1.000 | 1.000 |