 9
9peptides
spectra
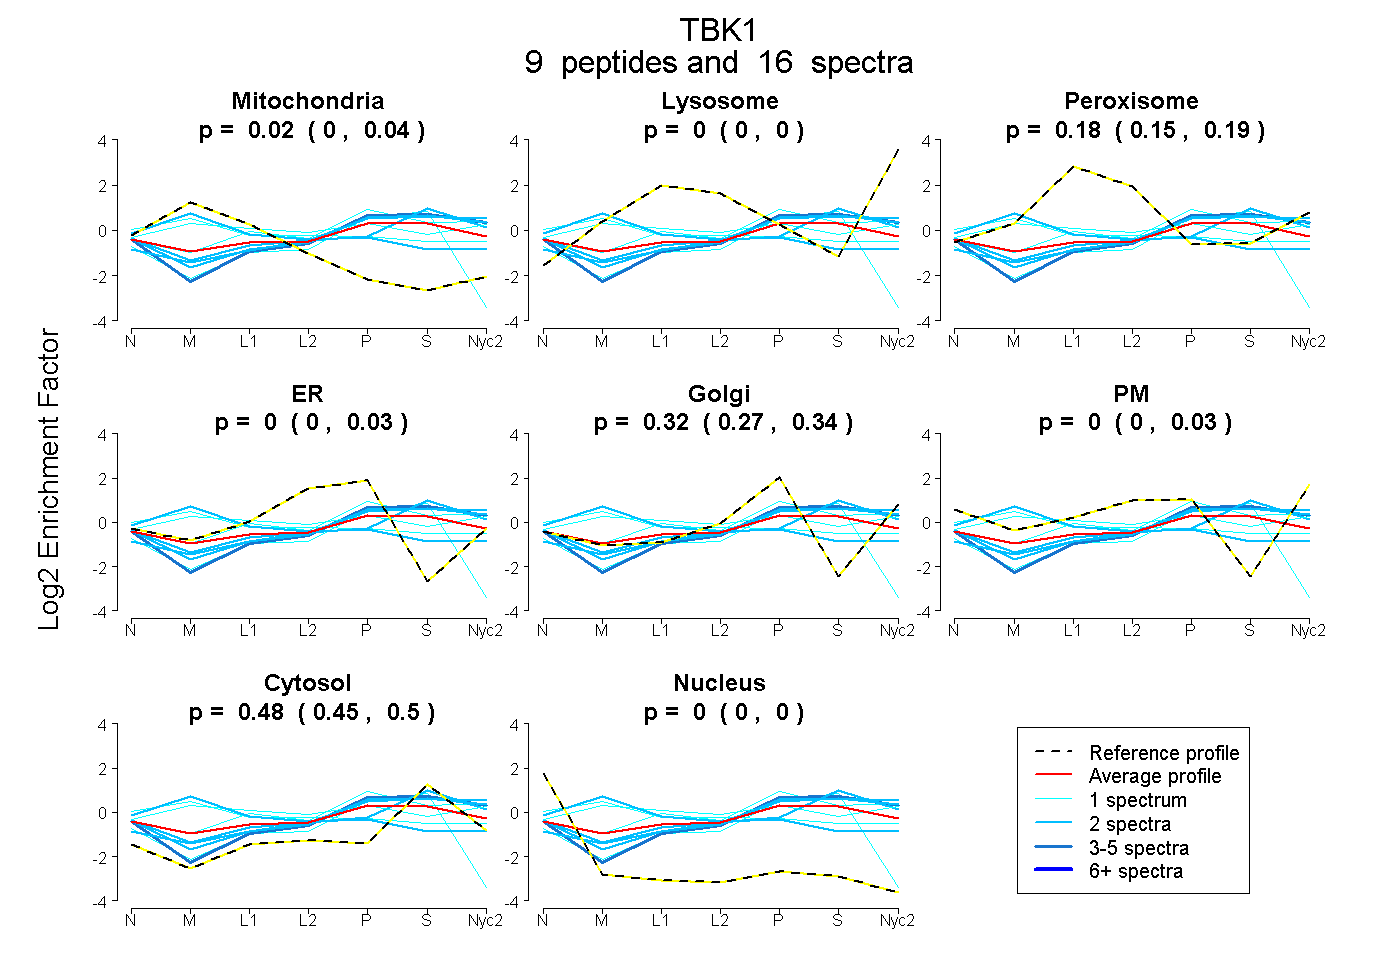
0.000 | 0.044
0.000 | 0.000
0.153 | 0.193
0.000 | 0.028
0.268 | 0.339
0.000 | 0.033
0.454 | 0.502
0.000 | 0.000
1peptide
spectrum
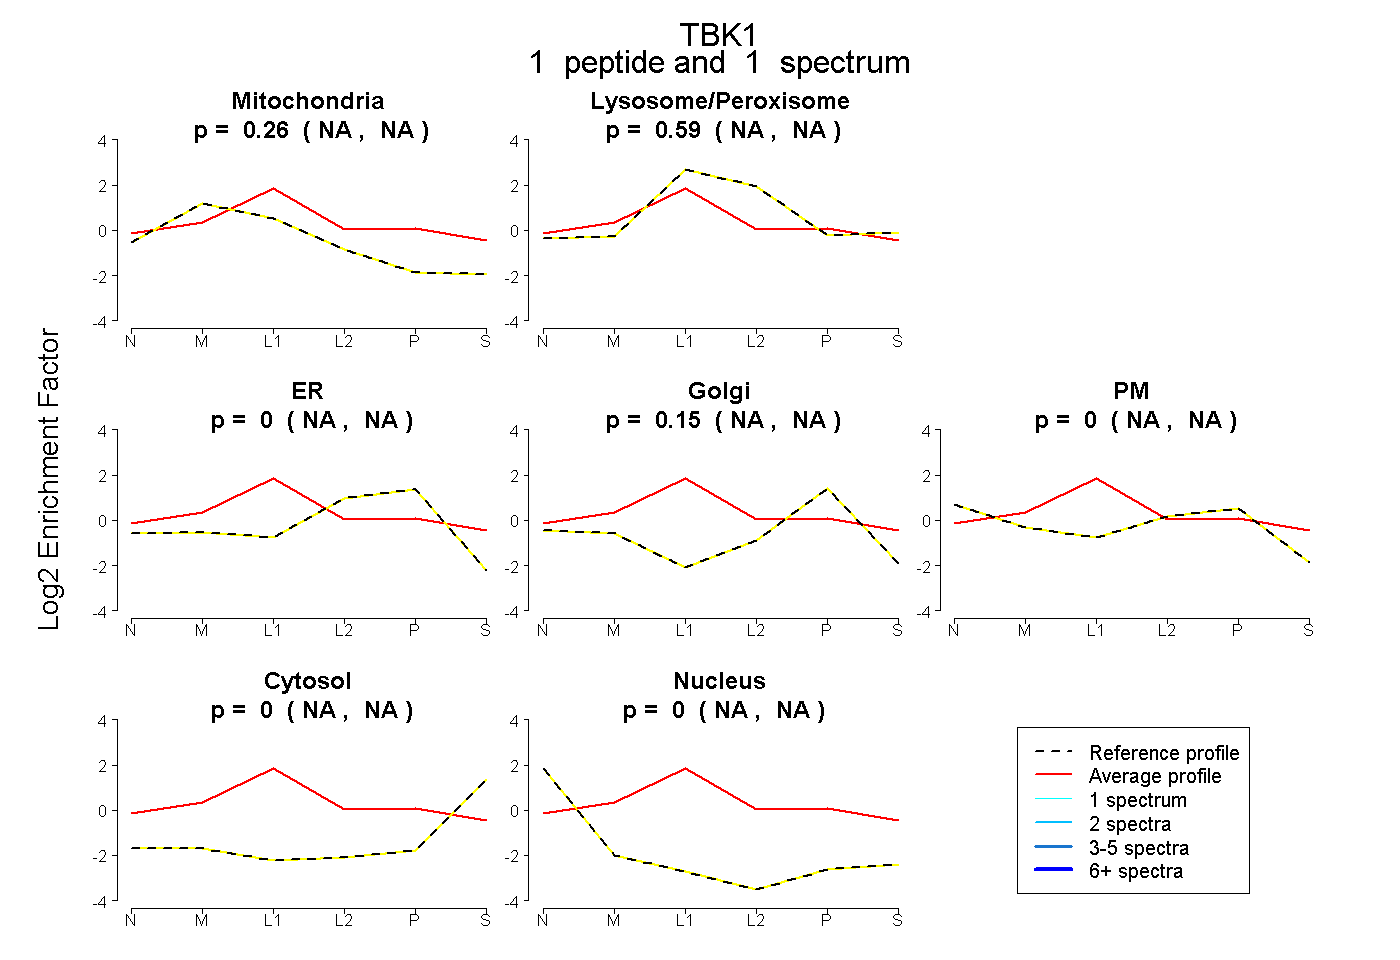
NA | NA
NA | NA
NA | NA
NA | NA
NA | NA
NA | NA
NA | NA
9peptides
spectra
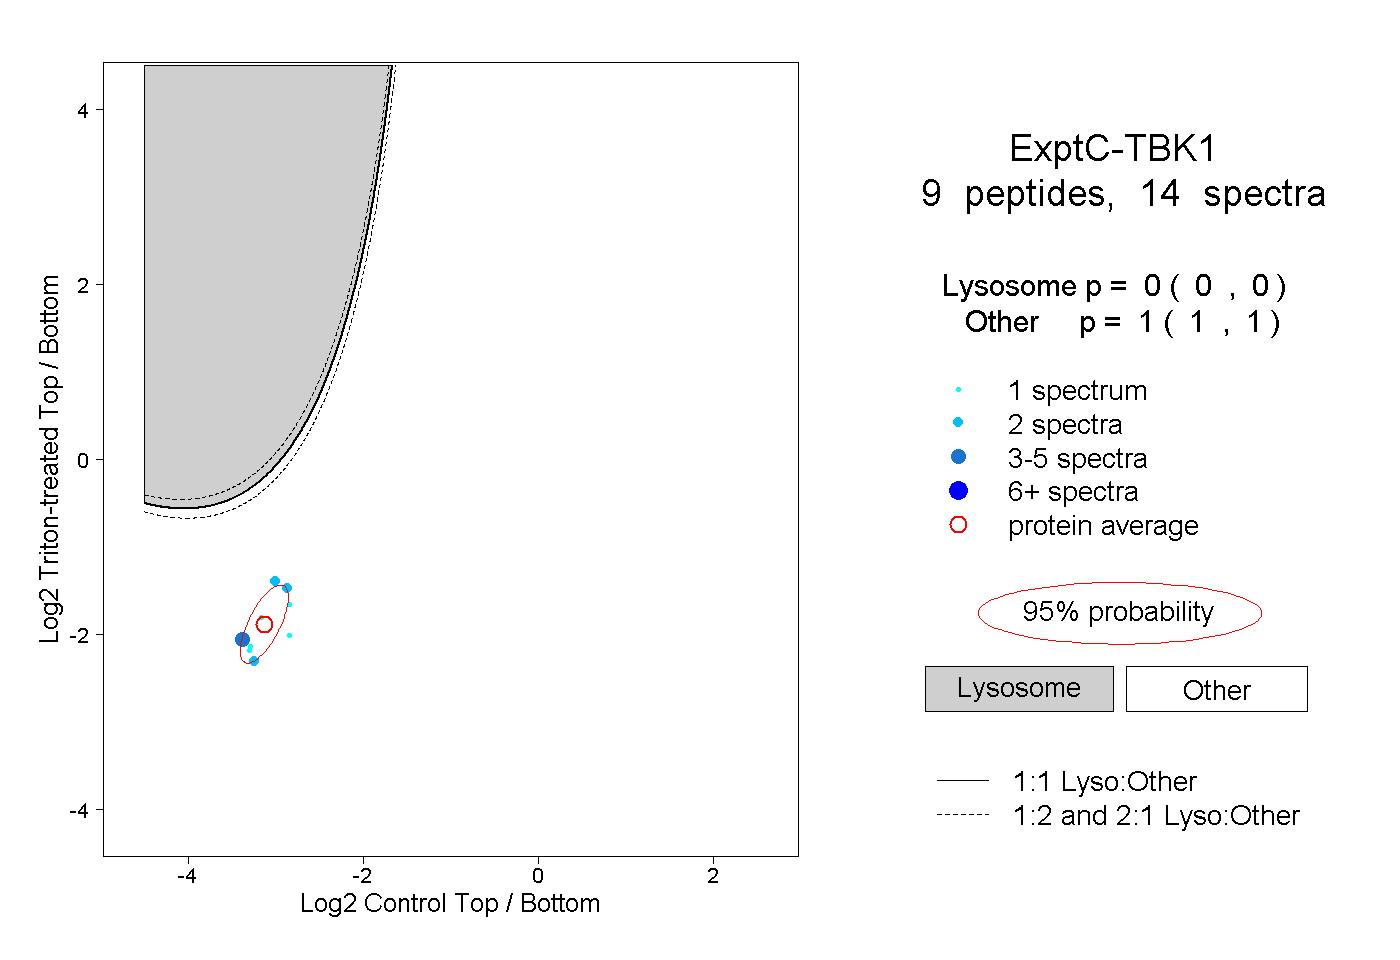
0.000 | 0.000
1.000 | 1.000
1peptide
spectrum

NA | NA
NA | NA