 9
9peptides
spectra
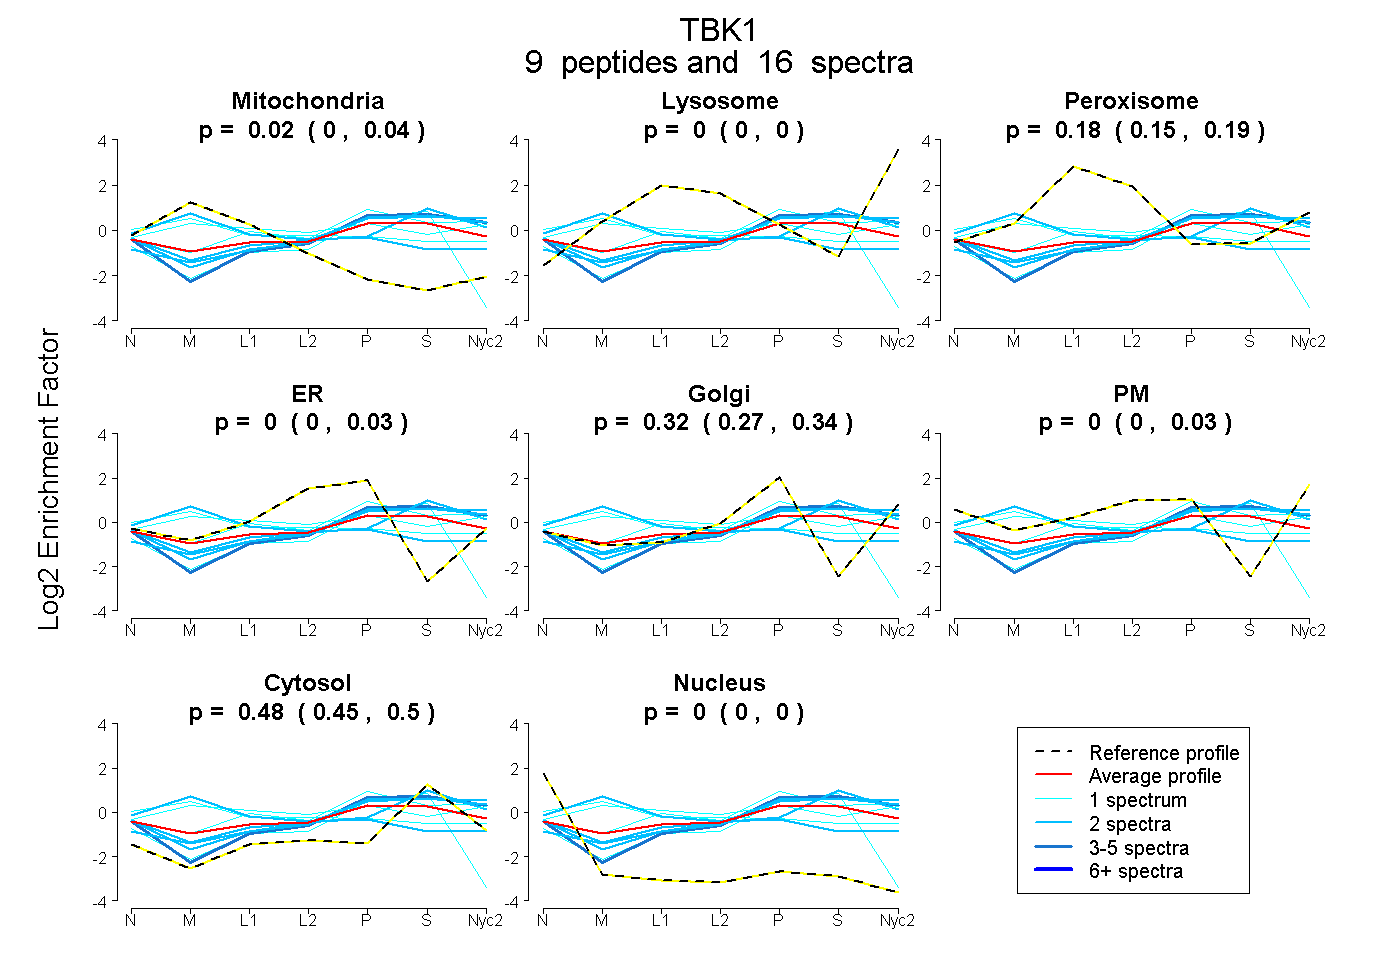
0.000 | 0.044
0.000 | 0.000
0.153 | 0.193
0.000 | 0.028
0.268 | 0.339
0.000 | 0.033
0.454 | 0.502
0.000 | 0.000
| Plot | Mito | Lyso | Perox | ER | Golgi | PM | Cytosol | Nucleus | |||||
| Expt A |
9 peptides |
16 spectra |
|
0.019 0.000 | 0.044 |
0.000 0.000 | 0.000 |
0.181 0.153 | 0.193 |
0.000 0.000 | 0.028 |
0.321 0.268 | 0.339 |
0.000 0.000 | 0.033 |
0.479 0.454 | 0.502 |
0.000 0.000 | 0.000 |
| 2 spectra, MLHLR | 0.421 | 0.000 | 0.169 | 0.000 | 0.243 | 0.000 | 0.168 | 0.000 | ||
| 2 spectra, LAYNEEQIHK | 0.000 | 0.111 | 0.042 | 0.000 | 0.073 | 0.091 | 0.684 | 0.000 | ||
| 4 spectra, EFEVLK | 0.000 | 0.028 | 0.000 | 0.000 | 0.312 | 0.066 | 0.594 | 0.000 | ||
| 1 spectrum, DIKPGNIMR | 0.000 | 0.045 | 0.202 | 0.000 | 0.377 | 0.000 | 0.376 | 0.000 | ||
| 1 spectrum, DVVGGMNHLR | 0.316 | 0.000 | 0.151 | 0.000 | 0.082 | 0.196 | 0.255 | 0.000 | ||
| 2 spectra, TTEENPIFVTSR | 0.000 | 0.102 | 0.000 | 0.000 | 0.162 | 0.193 | 0.542 | 0.000 | ||
| 1 spectrum, AVTGVVCYACR | 0.000 | 0.000 | 0.000 | 0.226 | 0.000 | 0.000 | 0.642 | 0.133 | ||
| 2 spectra, LFAIEEETTTR | 0.000 | 0.048 | 0.000 | 0.000 | 0.220 | 0.166 | 0.567 | 0.000 | ||
| 1 spectrum, LTDFGAAR | 0.128 | 0.068 | 0.264 | 0.000 | 0.269 | 0.031 | 0.240 | 0.000 |
| Plot | Mito | Lyso or Perox | ER | Golgi | PM | Cytosol | Nucleus | ||||||
| Expt B |
1 peptide |
1 spectrum |
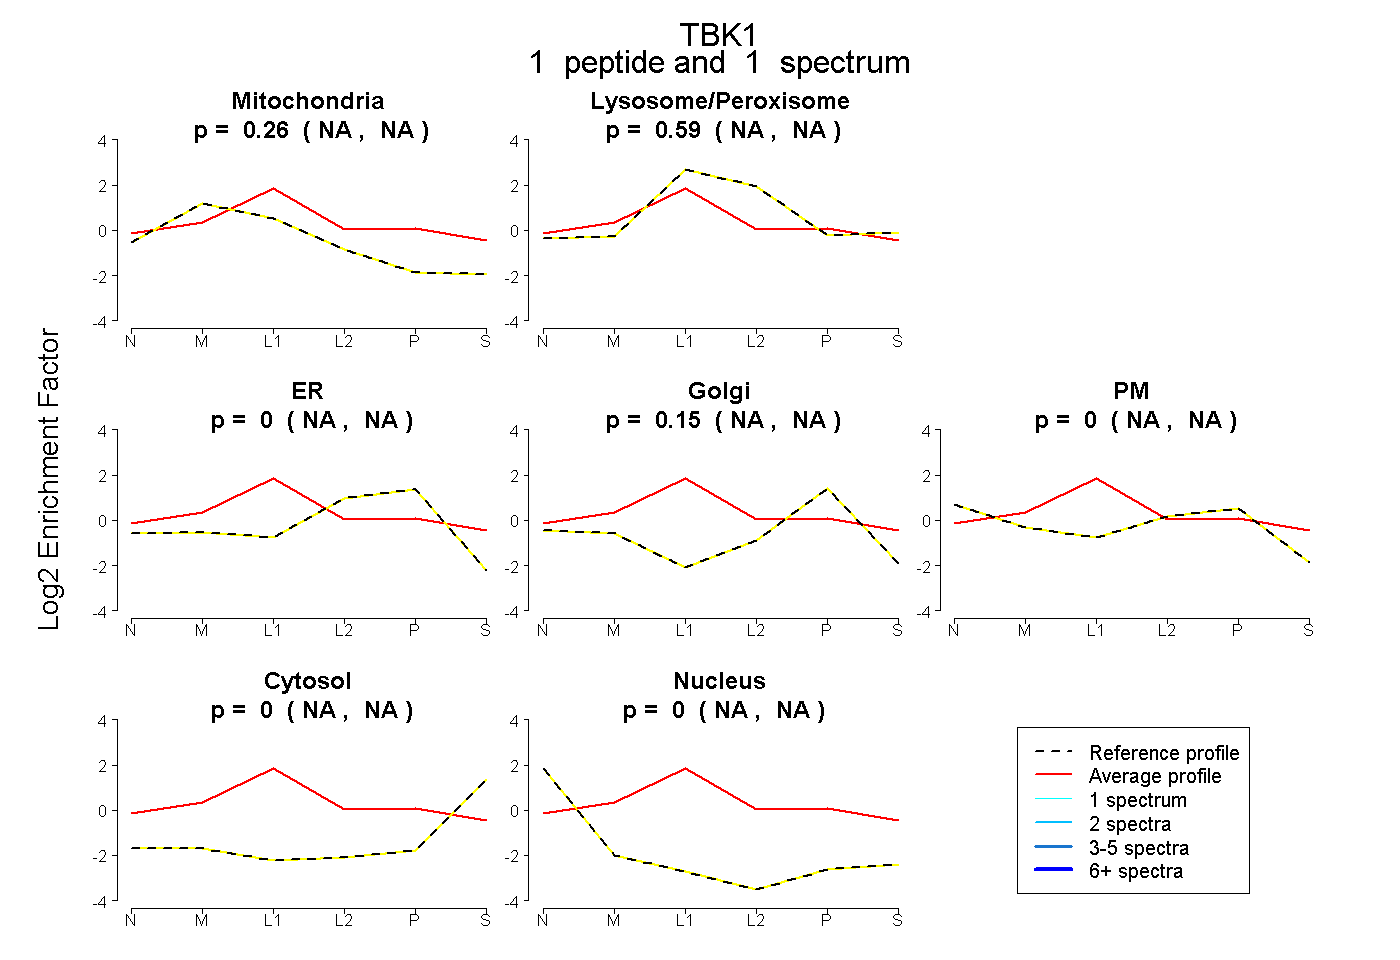 |
0.260 NA | NA |
0.588 NA | NA |
0.000 NA | NA |
0.148 NA | NA |
0.000 NA | NA |
0.004 NA | NA |
0.000 NA | NA |
|||
| Plot | Lyso | Other | |||||||||||
| Expt C |
9 peptides |
14 spectra |
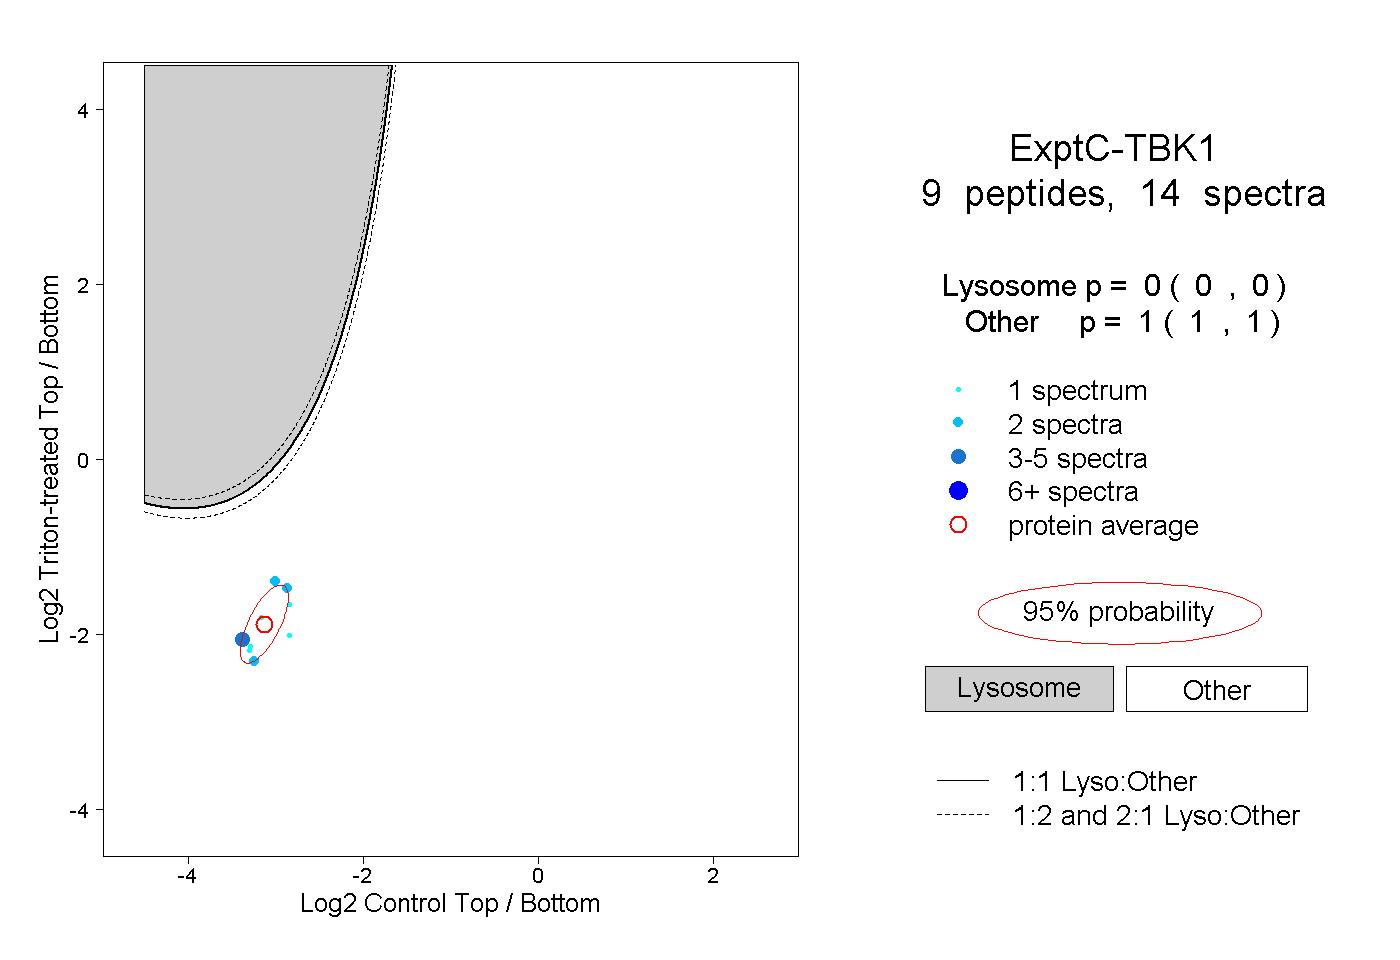 |
0.000 0.000 | 0.000 |
1.000 1.000 | 1.000 |
||||||||
| Plot | Lyso | Other | |||||||||||
| Expt D |
1 peptide |
1 spectrum |
 |
0.000 NA | NA |
1.000 NA | NA |