 2
2peptides
spectra
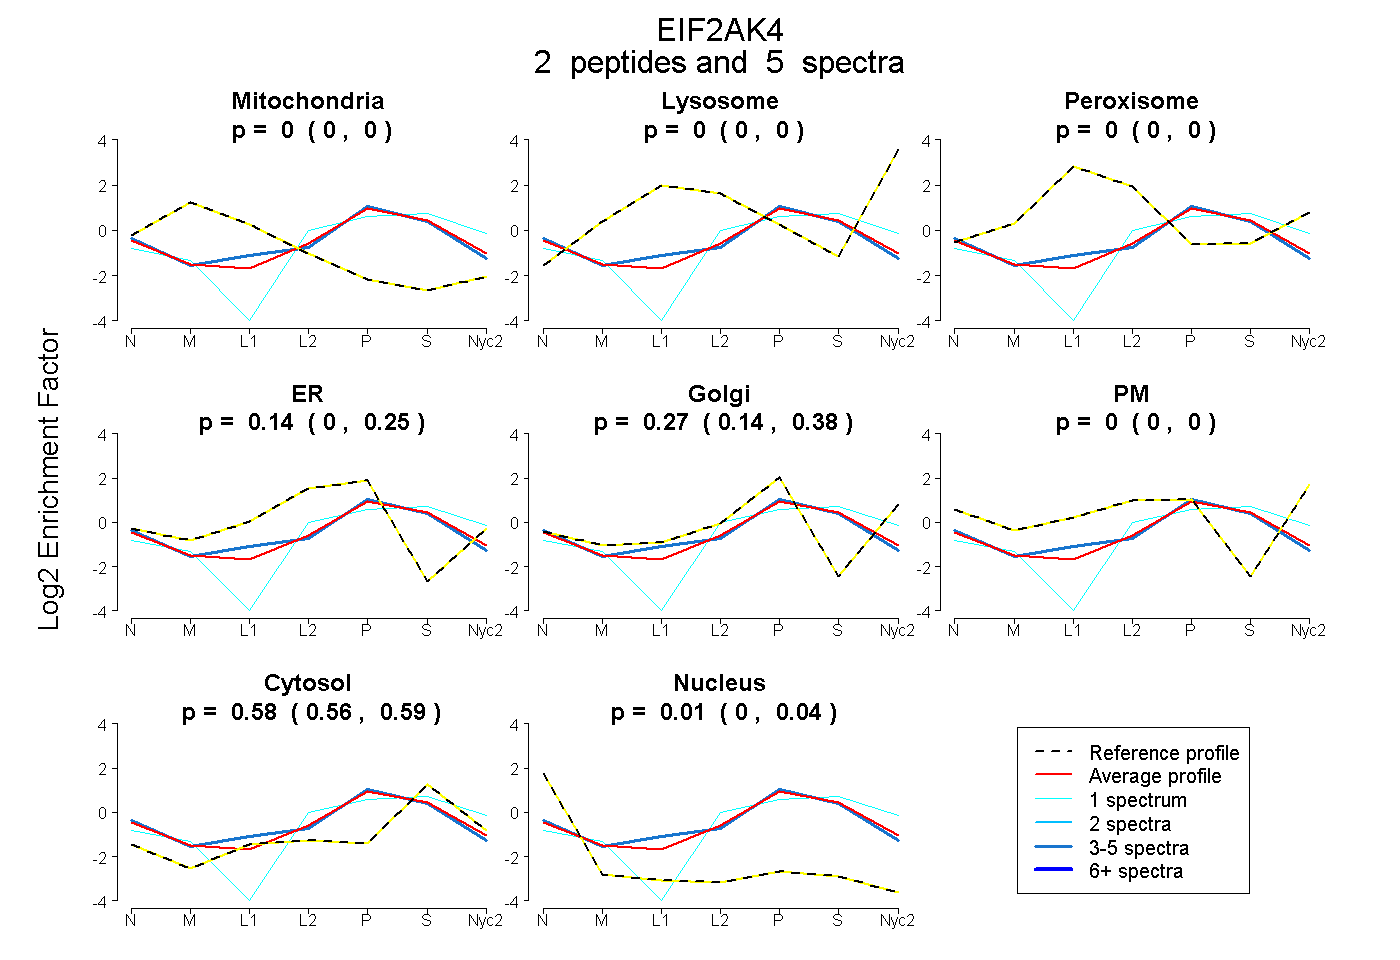
0.000 | 0.000
0.000 | 0.000
0.000 | 0.000
0.002 | 0.252
0.139 | 0.379
0.000 | 0.000
0.558 | 0.592
0.000 | 0.035
3peptides
spectra
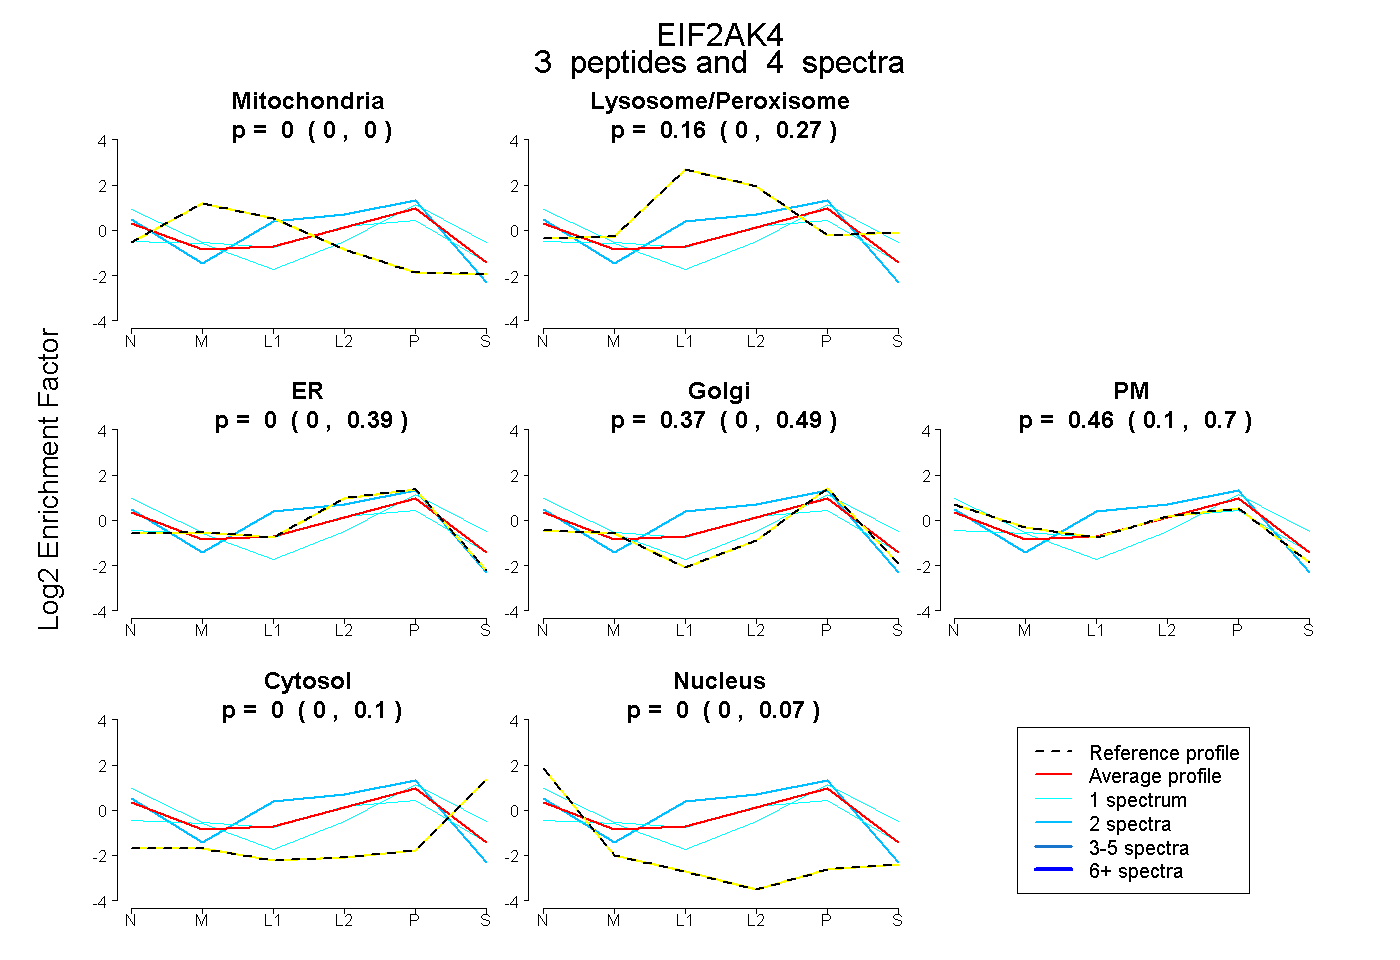
0.000 | 0.000
0.000 | 0.275
0.000 | 0.391
0.002 | 0.486
0.104 | 0.698
0.000 | 0.100
0.000 | 0.073
1peptide
spectra
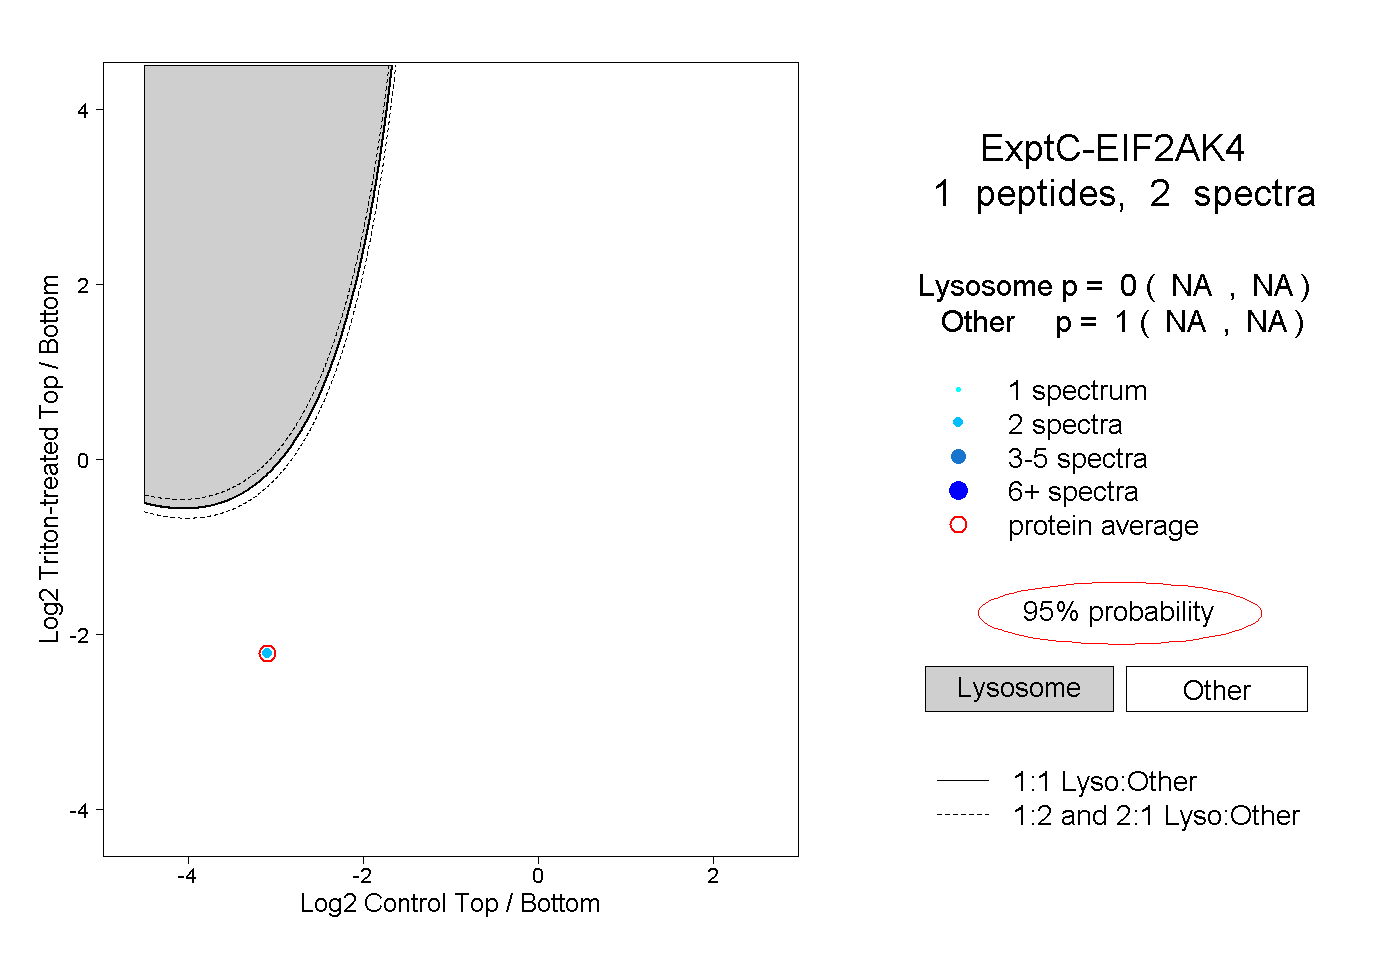
NA | NA
NA | NA