 2
2peptides
spectra
0.000 | 0.000
0.000 | 0.000
0.000 | 0.000
0.002 | 0.252
0.139 | 0.379
0.000 | 0.000
0.558 | 0.592
0.000 | 0.035
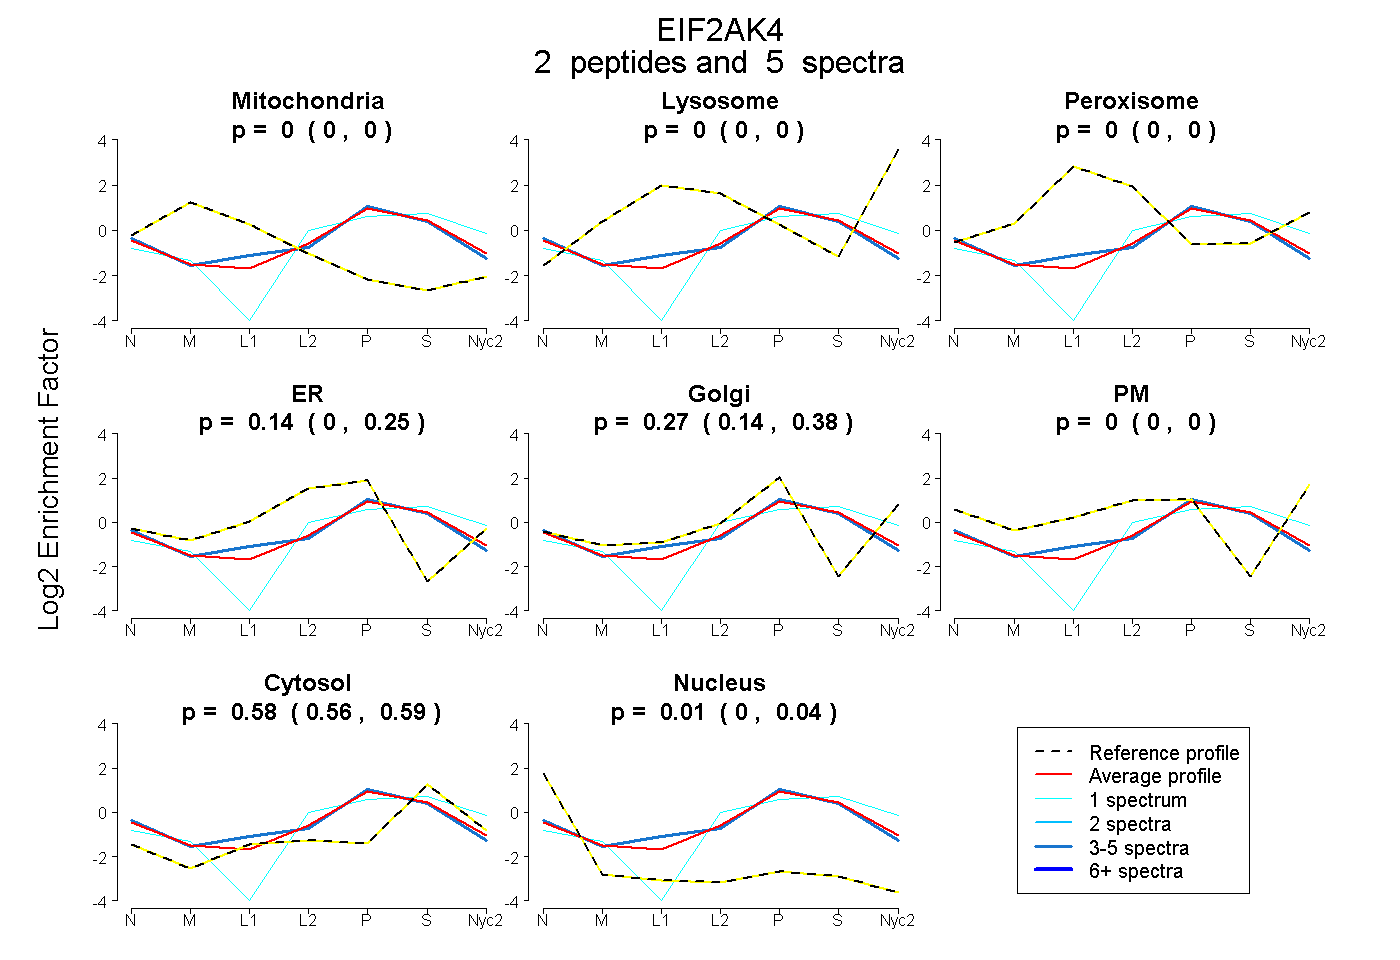
| Plot | Mito | Lyso | Perox | ER | Golgi | PM | Cytosol | Nucleus | |||||
| Expt A |
2 peptides |
5 spectra |
|
0.000 0.000 | 0.000 |
0.000 0.000 | 0.000 |
0.000 0.000 | 0.000 |
0.141 0.002 | 0.252 |
0.271 0.139 | 0.379 |
0.000 0.000 | 0.000 |
0.579 0.558 | 0.592 |
0.009 0.000 | 0.035 |
| 1 spectrum, DLEEVVGLLK | 0.000 | 0.000 | 0.000 | 0.000 | 0.378 | 0.000 | 0.622 | 0.000 | ||
| 4 spectra, FPDDFEDGEHTK | 0.000 | 0.000 | 0.000 | 0.254 | 0.161 | 0.000 | 0.567 | 0.018 |
| Plot | Mito | Lyso or Perox | ER | Golgi | PM | Cytosol | Nucleus | ||||||
| Expt B |
3 peptides |
4 spectra |
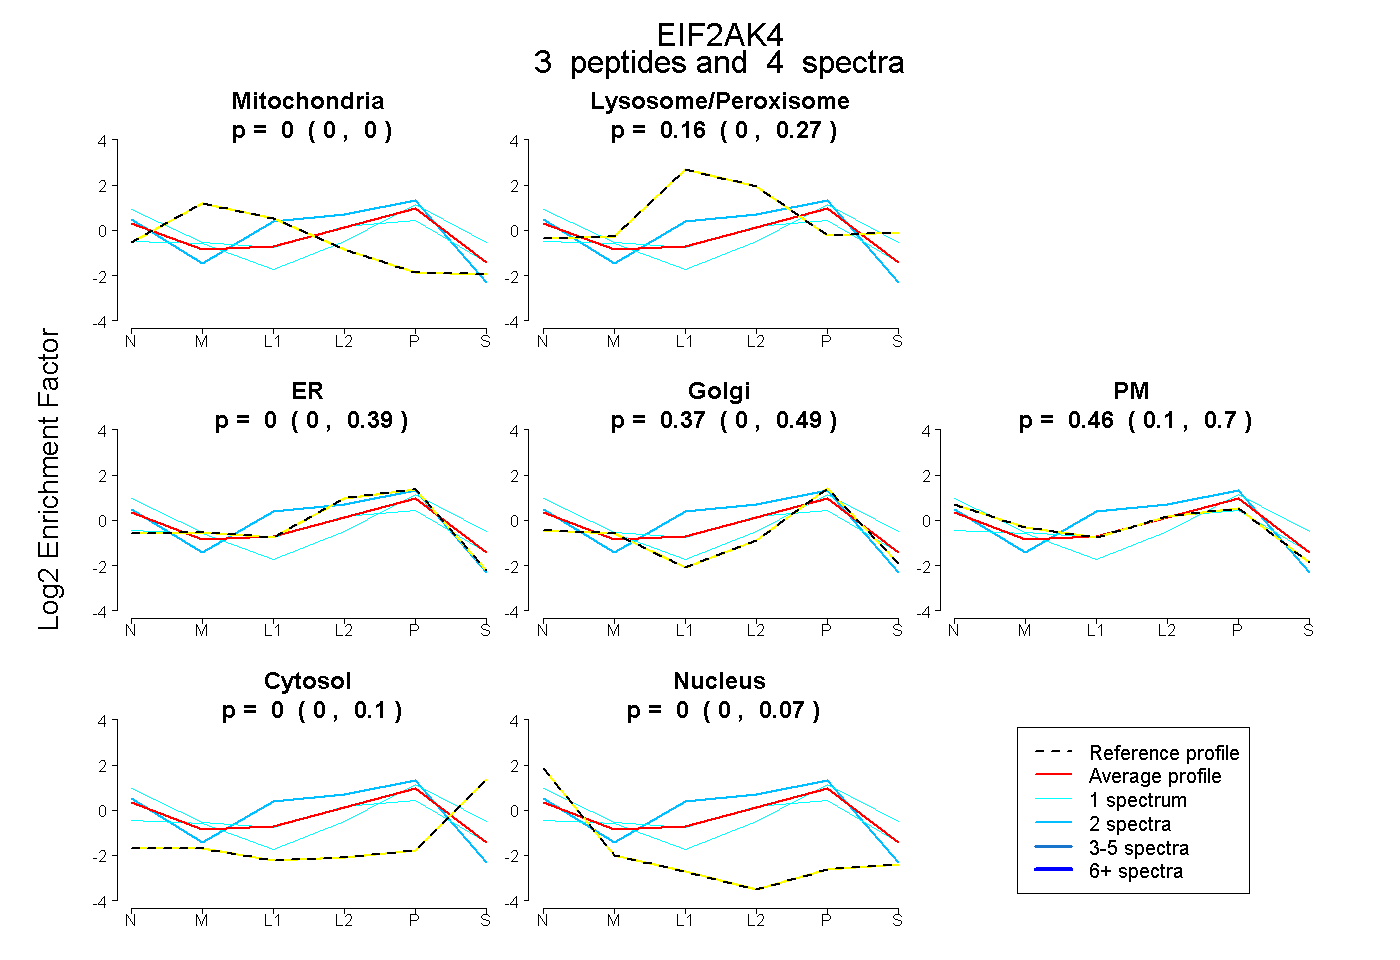 |
0.000 0.000 | 0.000 |
0.165 0.000 | 0.275 |
0.000 0.000 | 0.391 |
0.374 0.002 | 0.486 |
0.462 0.104 | 0.698 |
0.000 0.000 | 0.100 |
0.000 0.000 | 0.073 |
|||
| Plot | Lyso | Other | |||||||||||
| Expt C |
1 peptide |
2 spectra |
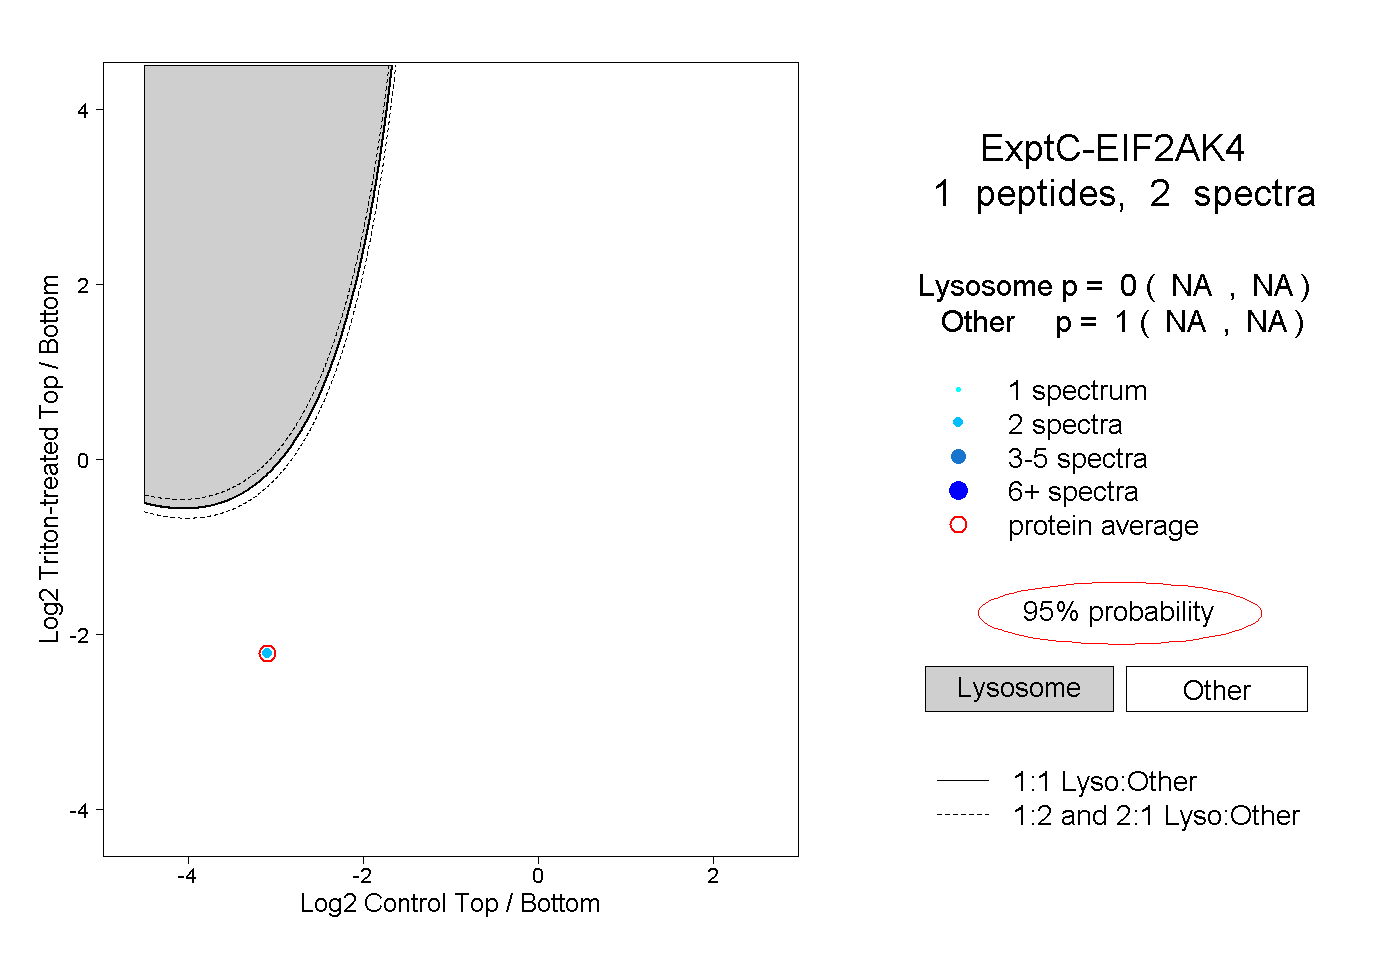 |
0.000 NA | NA |
1.000 NA | NA |