 3
3peptides
spectra
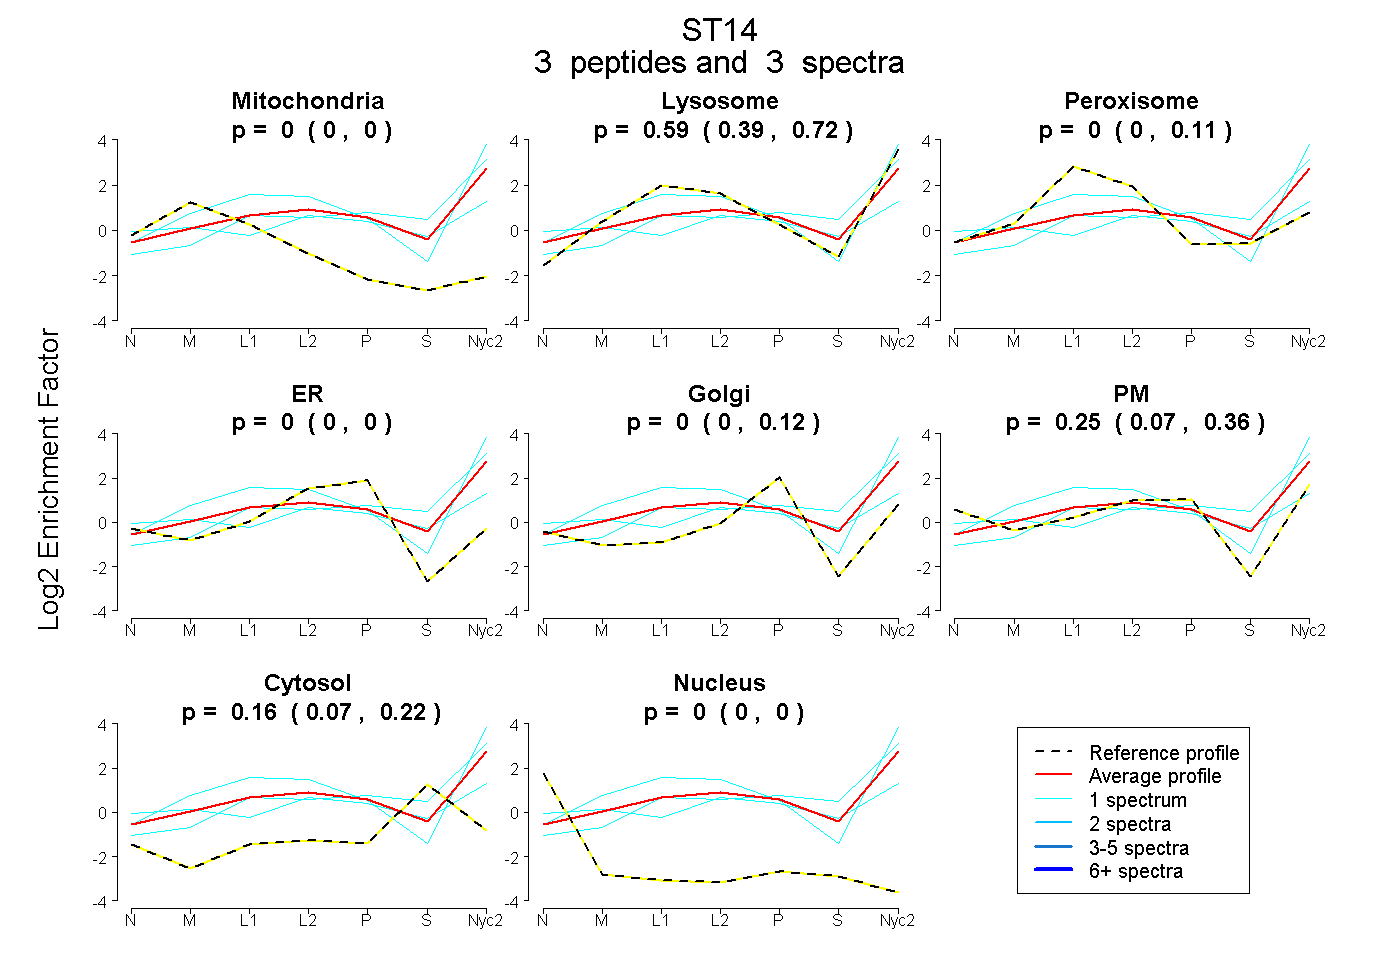
0.000 | 0.000
0.393 | 0.719
0.000 | 0.114
0.000 | 0.000
0.000 | 0.123
0.073 | 0.363
0.066 | 0.218
0.000 | 0.000
2peptides
spectra
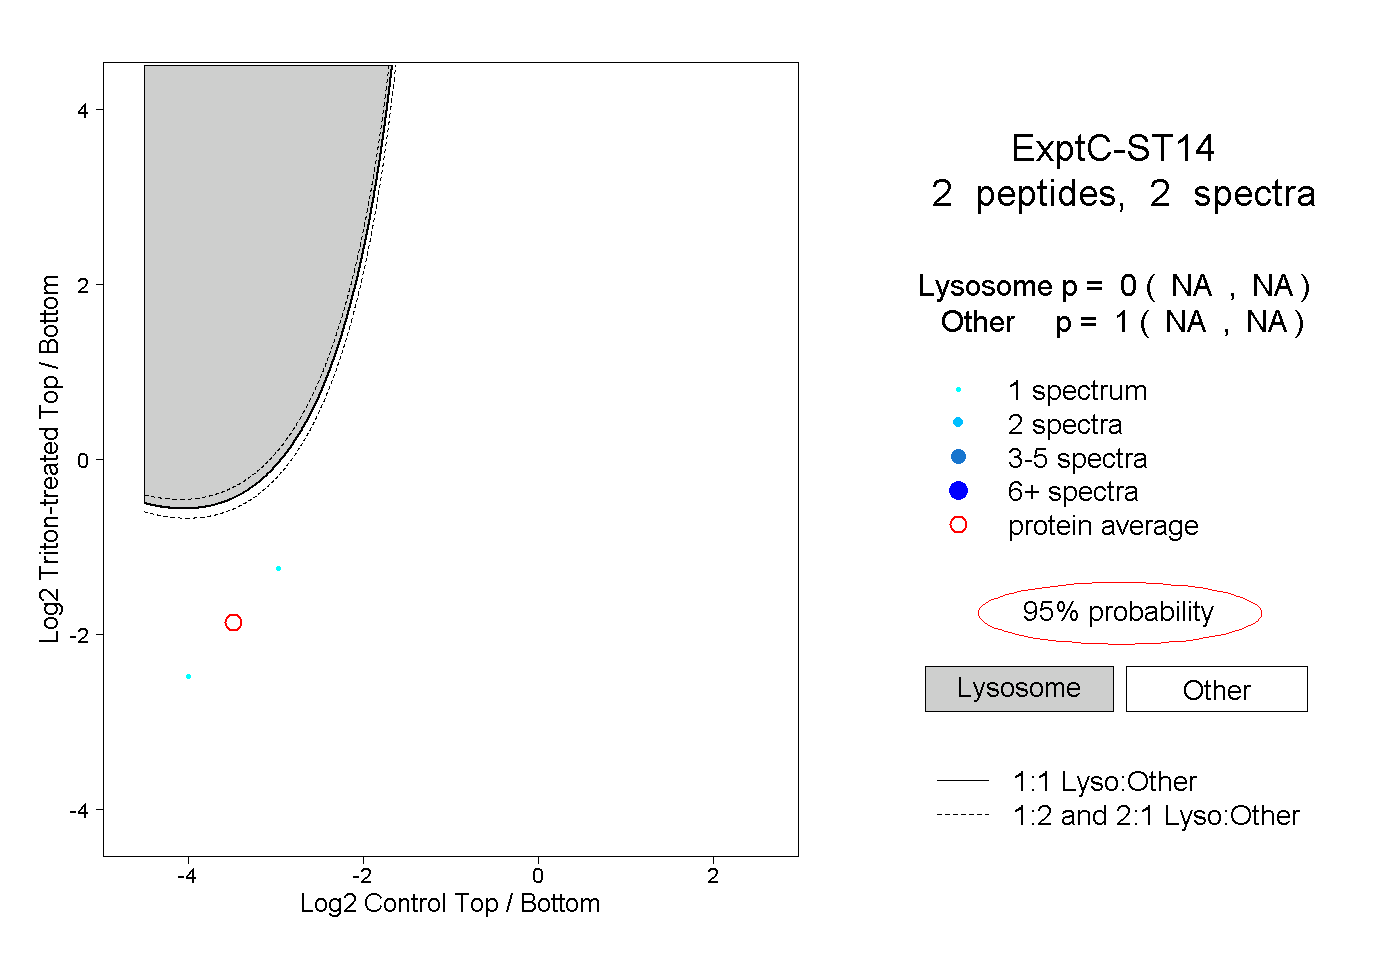
NA | NA
NA | NA
1peptide
spectrum
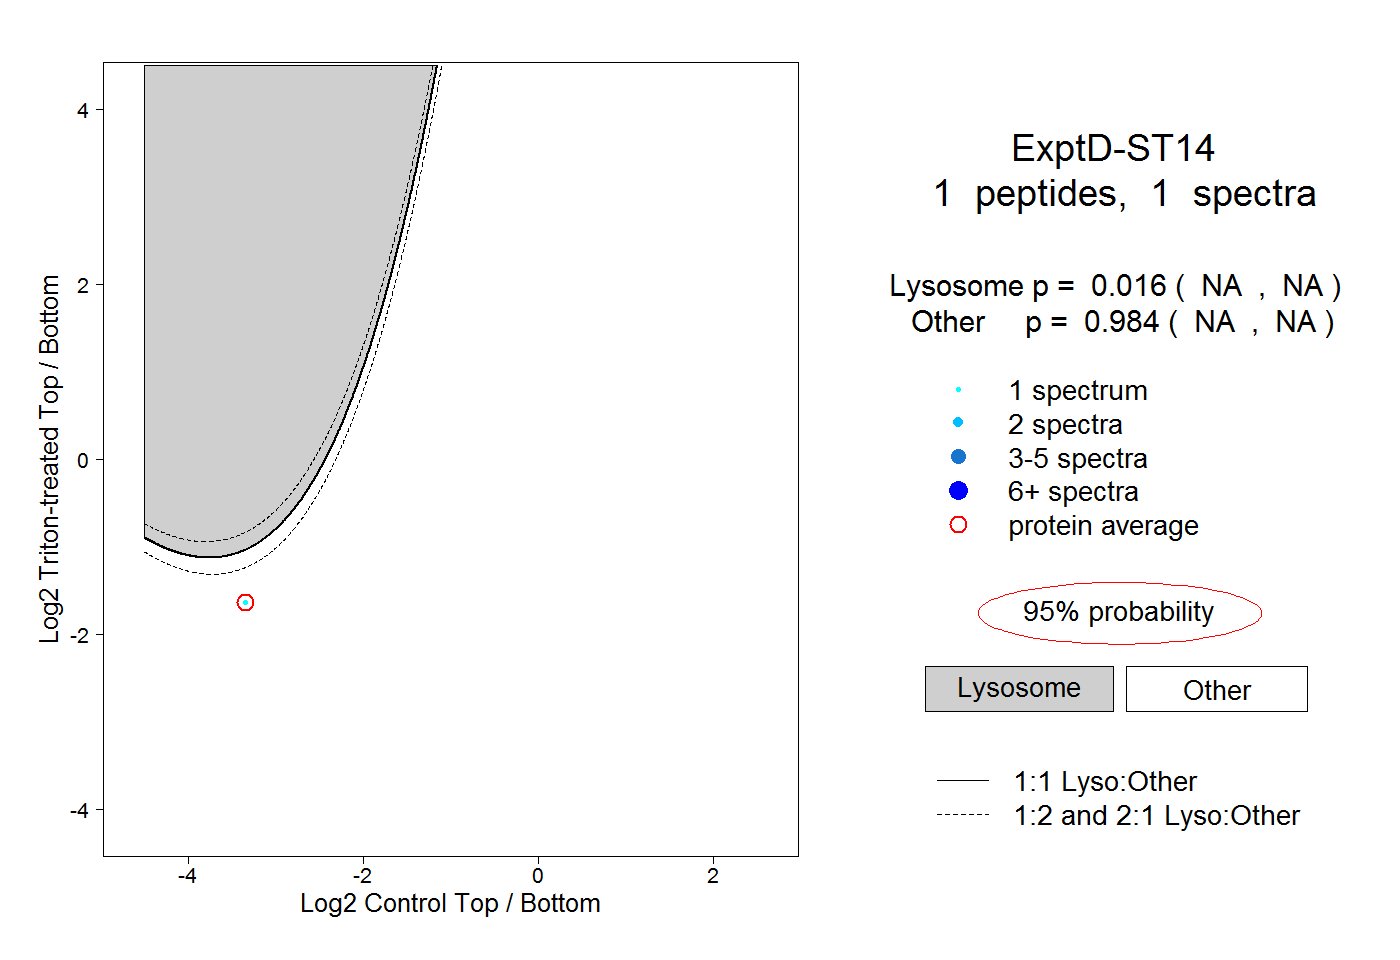
NA | NA
NA | NA