 3
3peptides
spectra
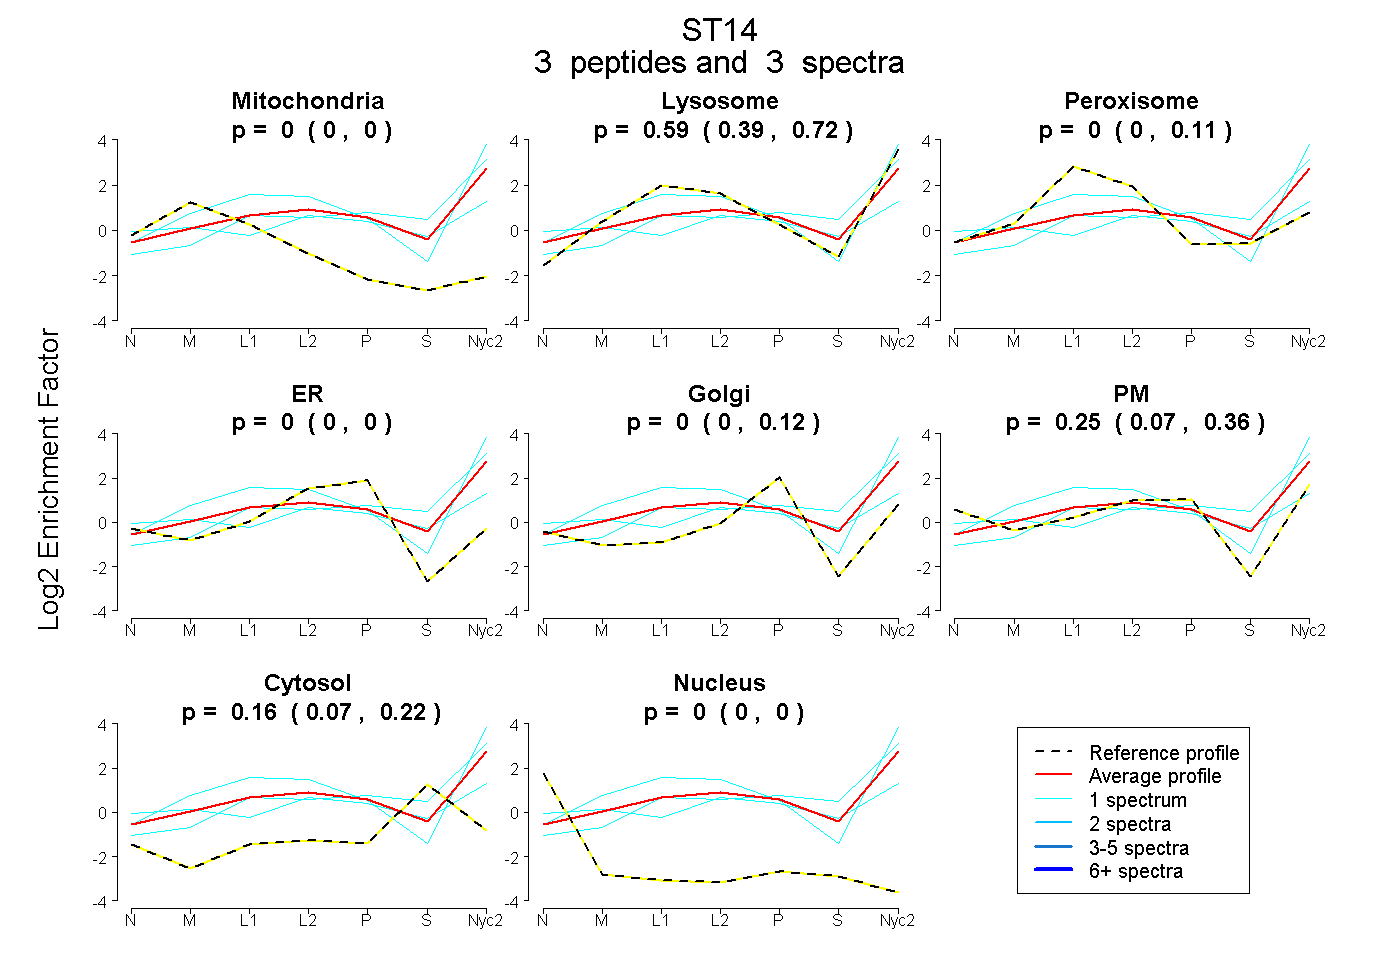
0.000 | 0.000
0.393 | 0.719
0.000 | 0.114
0.000 | 0.000
0.000 | 0.123
0.073 | 0.363
0.066 | 0.218
0.000 | 0.000
| Plot | Mito | Lyso | Perox | ER | Golgi | PM | Cytosol | Nucleus | |||||
| Expt A |
3 peptides |
3 spectra |
|
0.000 0.000 | 0.000 |
0.589 0.393 | 0.719 |
0.000 0.000 | 0.114 |
0.000 0.000 | 0.000 |
0.000 0.000 | 0.123 |
0.253 0.073 | 0.363 |
0.158 0.066 | 0.218 |
0.000 0.000 | 0.000 |
| 1 spectrum, AIWVTGWGHTK | 0.000 | 0.814 | 0.000 | 0.000 | 0.000 | 0.186 | 0.000 | 0.000 | ||
| 1 spectrum, NKPGVYTR | 0.000 | 0.700 | 0.000 | 0.000 | 0.037 | 0.000 | 0.263 | 0.000 | ||
| 1 spectrum, LFYLVDPNIPVGSCTK | 0.000 | 0.174 | 0.073 | 0.000 | 0.000 | 0.477 | 0.275 | 0.000 |
| Plot | Lyso | Other | |||||||||||
| Expt C |
2 peptides |
2 spectra |
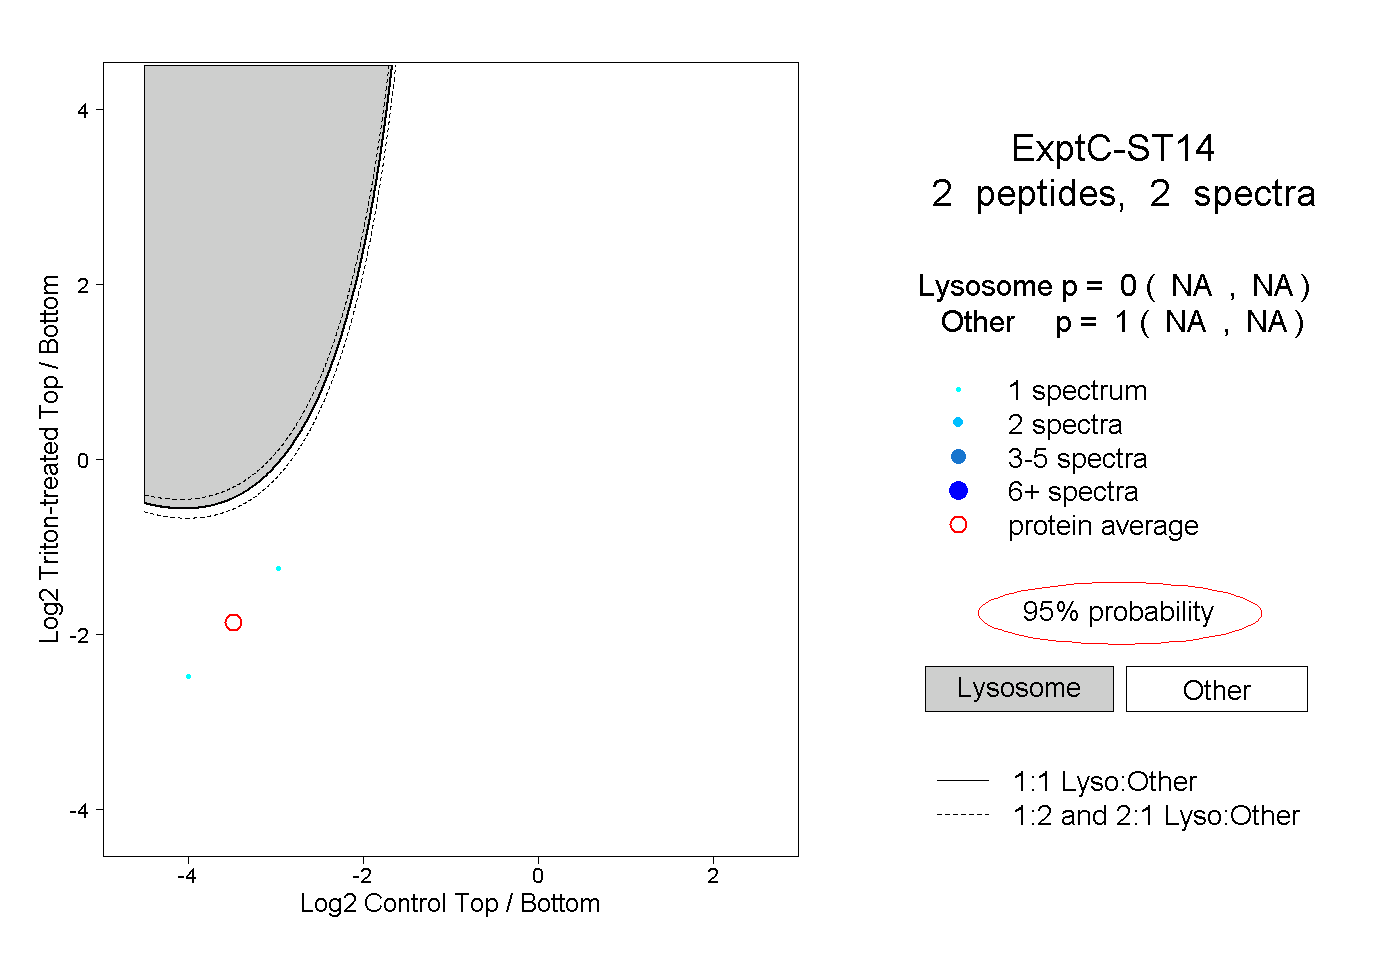 |
0.000 NA | NA |
1.000 NA | NA |
||||||||
| Plot | Lyso | Other | |||||||||||
| Expt D |
1 peptide |
1 spectrum |
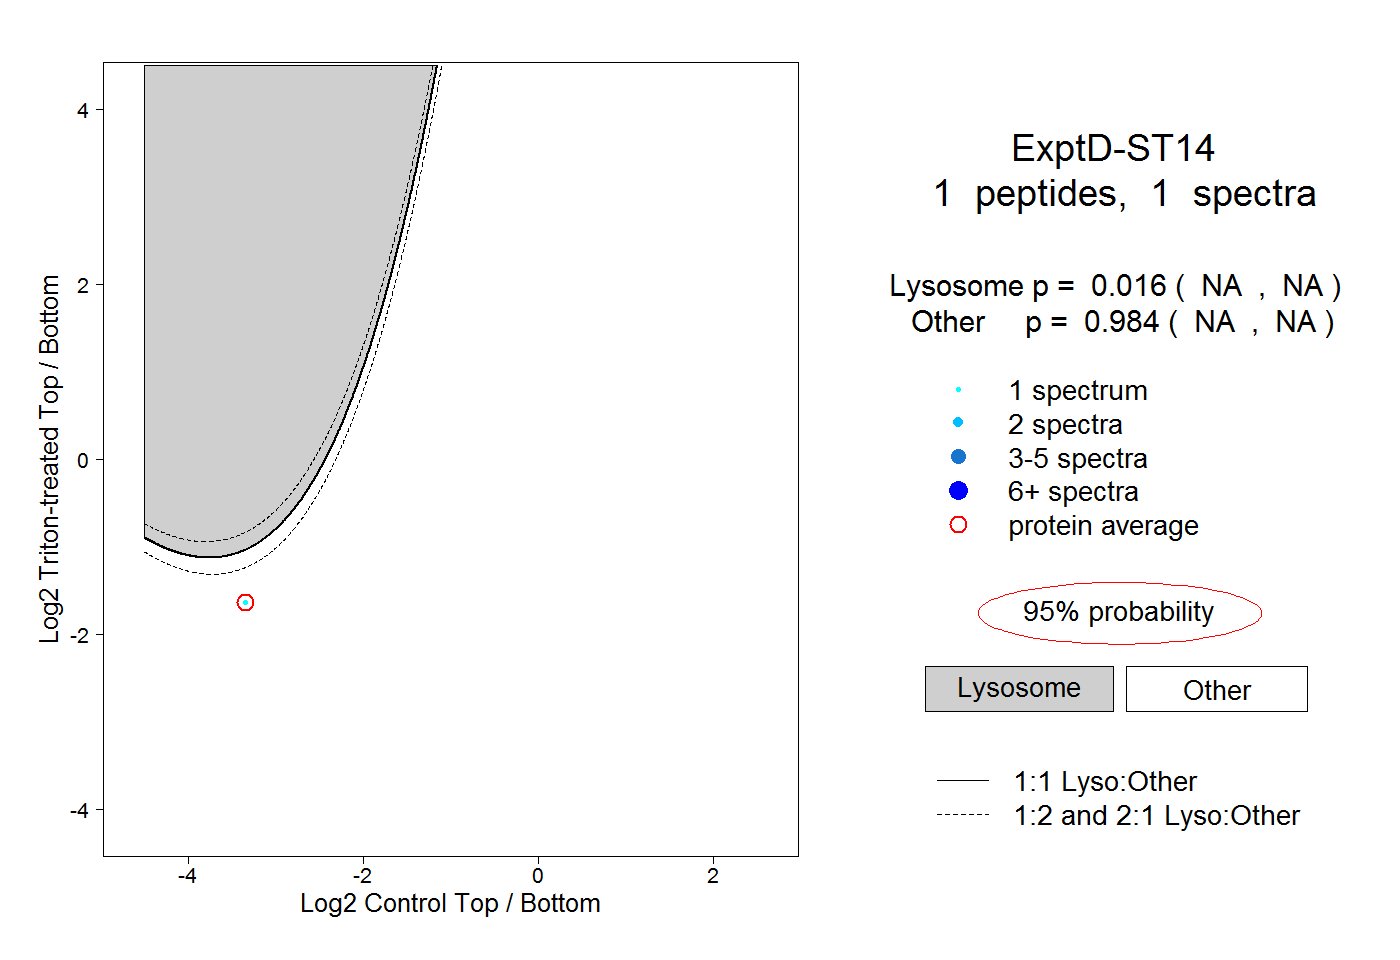 |
0.016 NA | NA |
0.984 NA | NA |