 5
5peptides
spectra
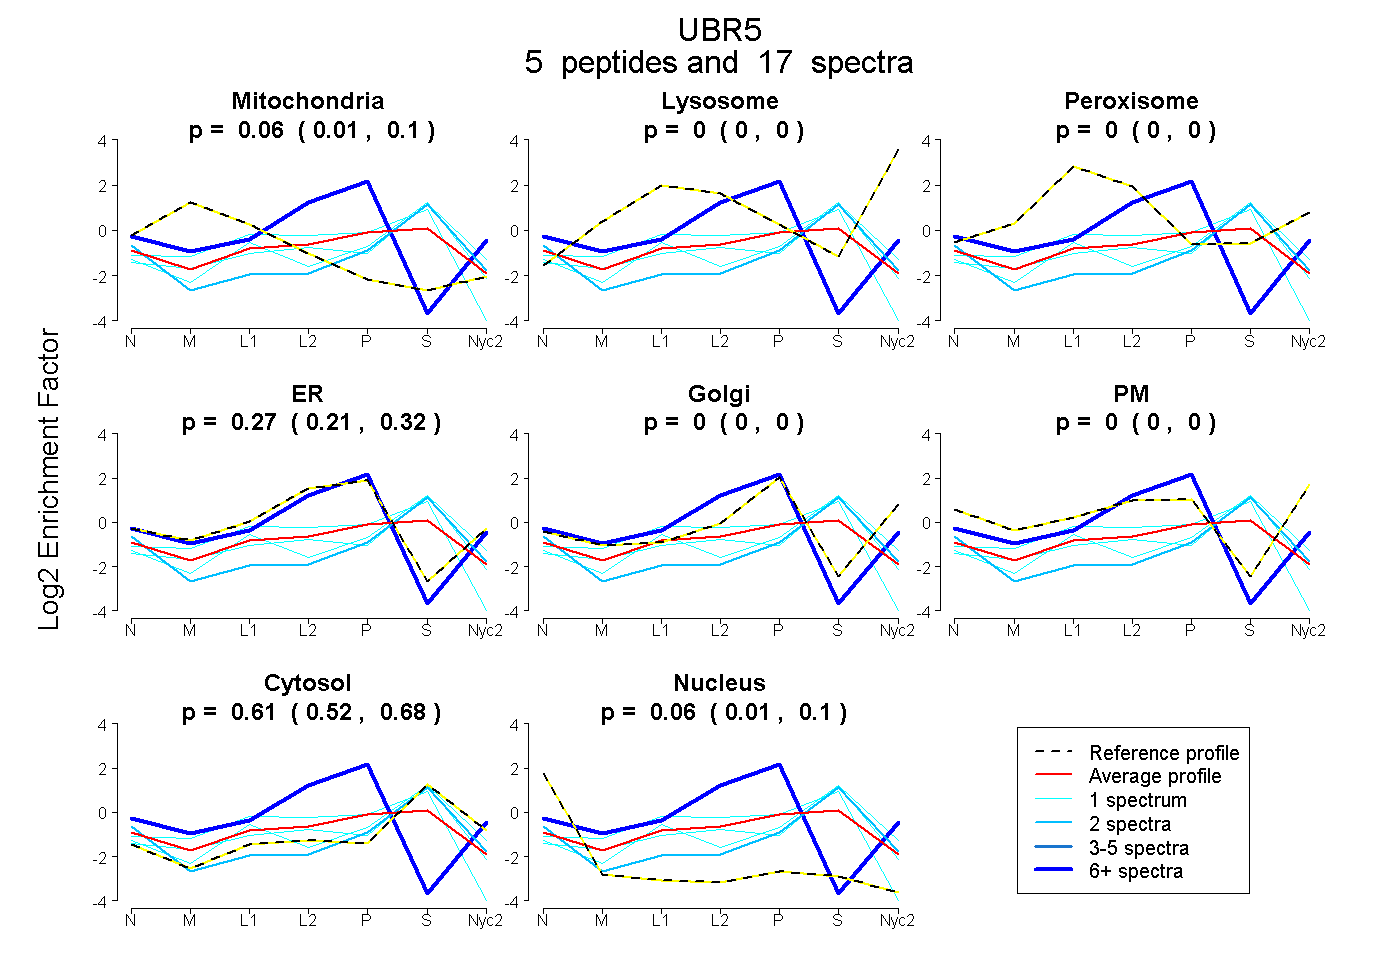
0.014 | 0.101
0.000 | 0.000
0.000 | 0.000
0.210 | 0.320
0.000 | 0.000
0.000 | 0.000
0.525 | 0.682
0.013 | 0.098
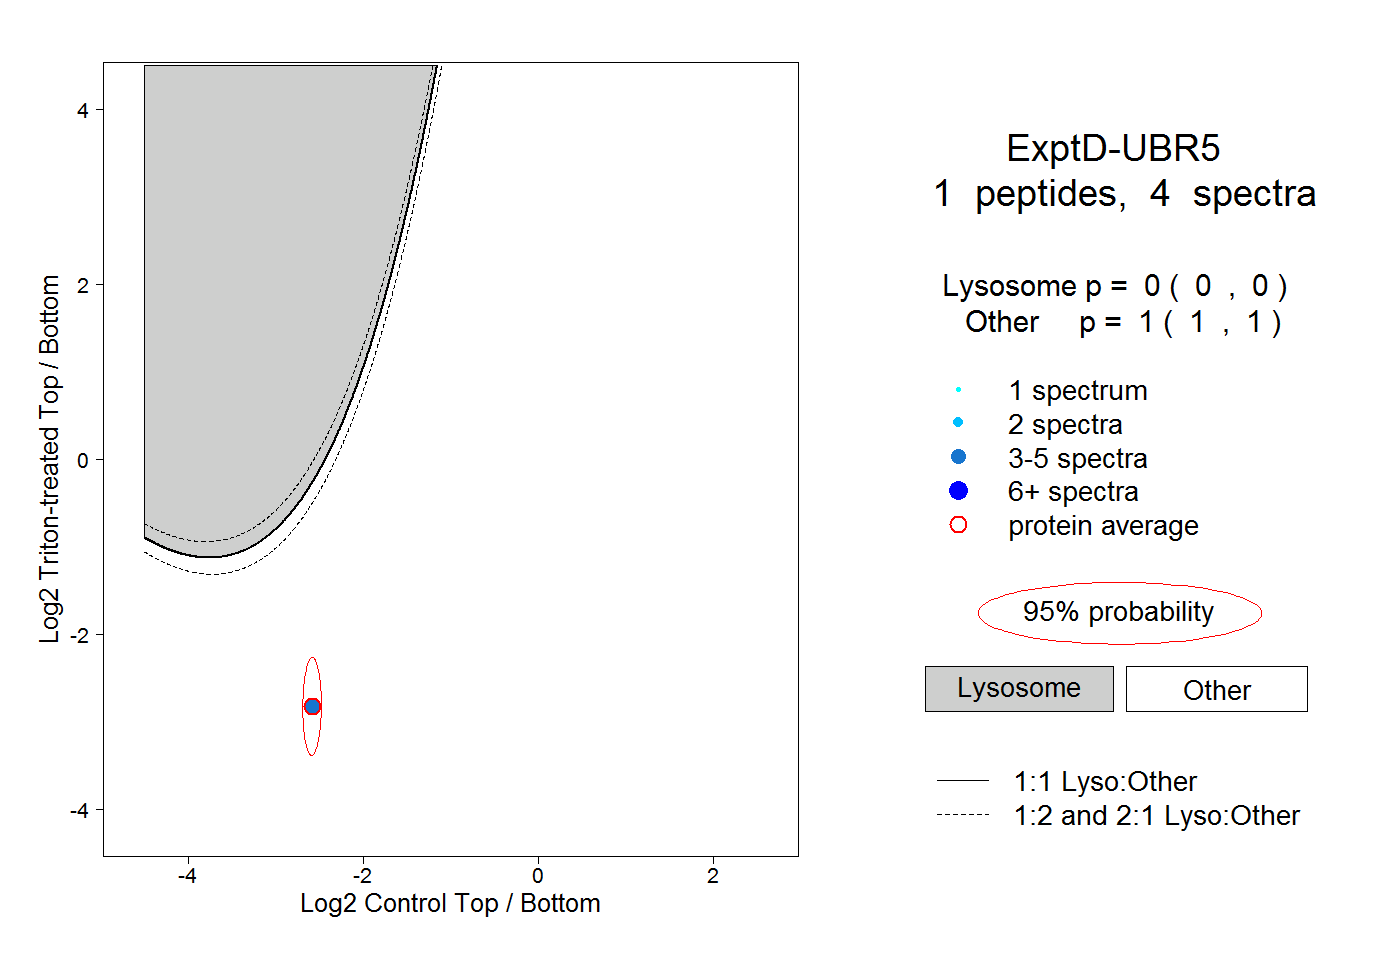
1peptide
spectra

0.000 | 0.000
1.000 | 1.000
1peptide
spectra
0.000 | 0.000
1.000 | 1.000