 5
5peptides
spectra
0.014 | 0.101
0.000 | 0.000
0.000 | 0.000
0.210 | 0.320
0.000 | 0.000
0.000 | 0.000
0.525 | 0.682
0.013 | 0.098
| Plot | Mito | Lyso | Perox | ER | Golgi | PM | Cytosol | Nucleus | |||||
| Expt A |
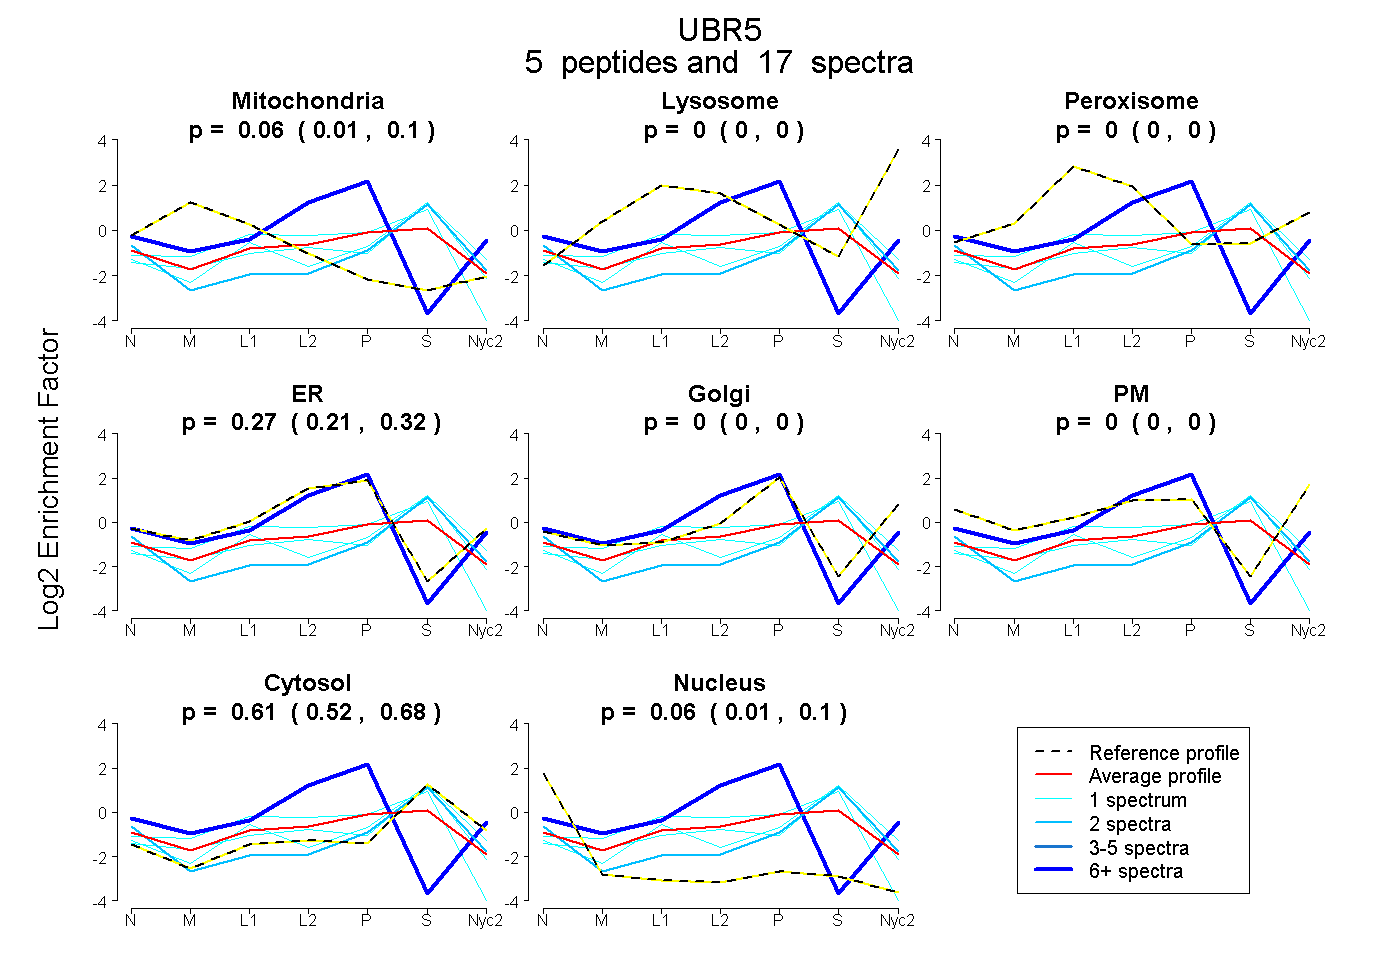
5 peptides |
17 spectra |
|
0.061 0.014 | 0.101 |
0.000 0.000 | 0.000 |
0.000 0.000 | 0.000 |
0.271 0.210 | 0.320 |
0.000 0.000 | 0.000 |
0.000 0.000 | 0.000 |
0.607 0.525 | 0.682 |
0.061 0.013 | 0.098 |
| 1 spectrum, VEEAMELIVAHGR | 0.243 | 0.000 | 0.000 | 0.141 | 0.000 | 0.000 | 0.616 | 0.000 | ||
| 1 spectrum, TASPDDSDMPDHDLEPPR | 0.078 | 0.000 | 0.000 | 0.020 | 0.000 | 0.000 | 0.882 | 0.020 | ||
| 2 spectra, VLQDWNALR | 0.000 | 0.000 | 0.000 | 0.000 | 0.000 | 0.000 | 0.838 | 0.162 | ||
| 1 spectrum, AYPAAITILETAQK | 0.060 | 0.000 | 0.076 | 0.021 | 0.000 | 0.000 | 0.843 | 0.000 | ||
| 12 spectra, VLLGR | 0.000 | 0.000 | 0.000 | 0.889 | 0.078 | 0.000 | 0.000 | 0.034 |
| Plot | Lyso | Other | |||||||||||
| Expt C |
1 peptide |
8 spectra |
 |
0.000 0.000 | 0.000 |
1.000 1.000 | 1.000 |
||||||||
| Plot | Lyso | Other | |||||||||||
| Expt D |
1 peptide |
4 spectra |
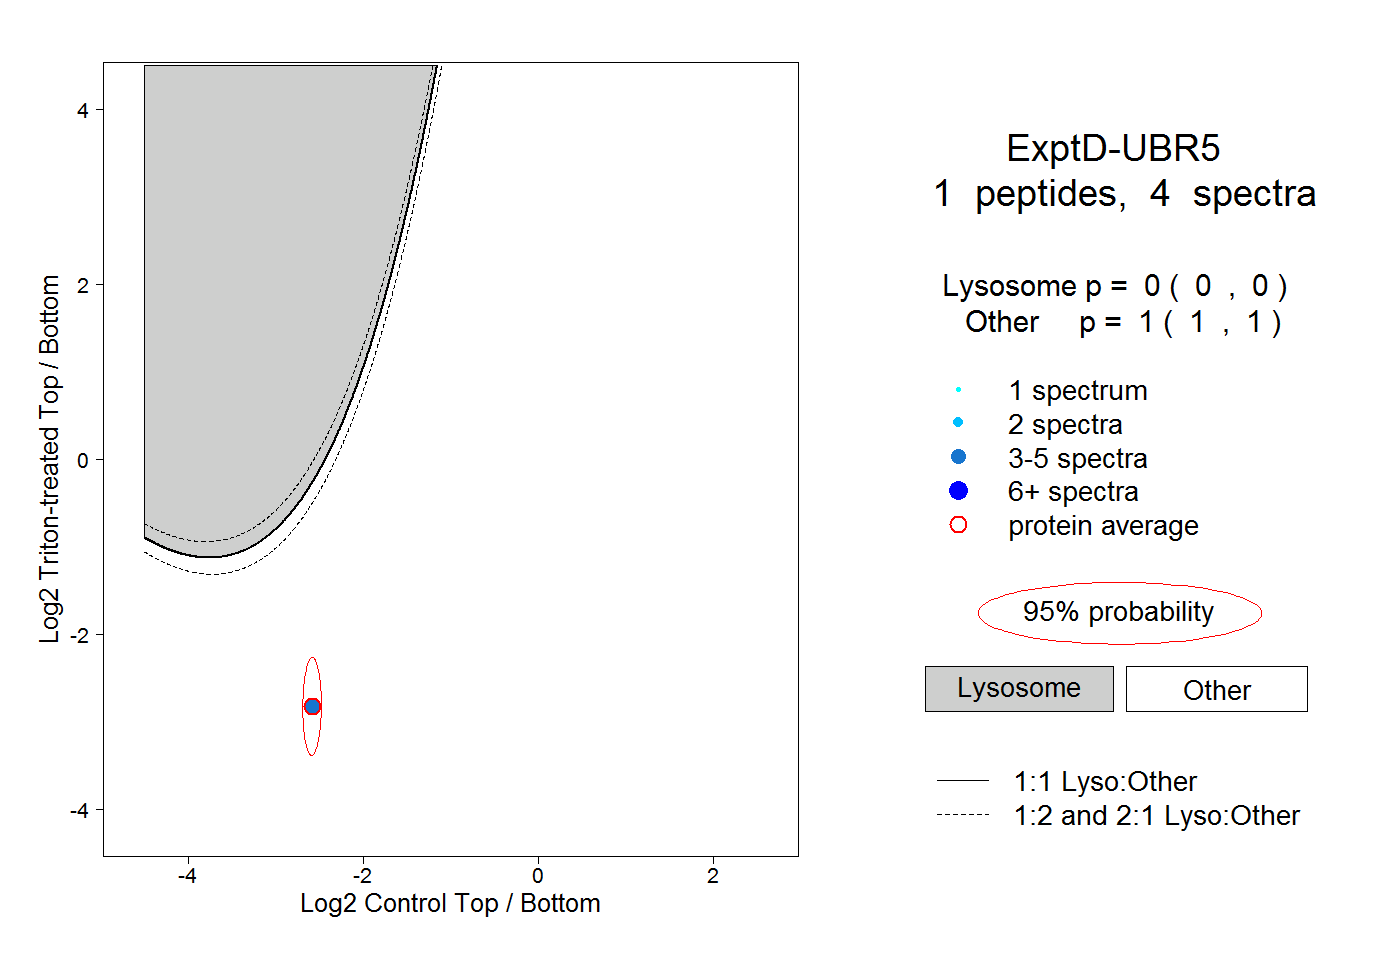 |
0.000 0.000 | 0.000 |
1.000 1.000 | 1.000 |