 6
6peptides
spectra
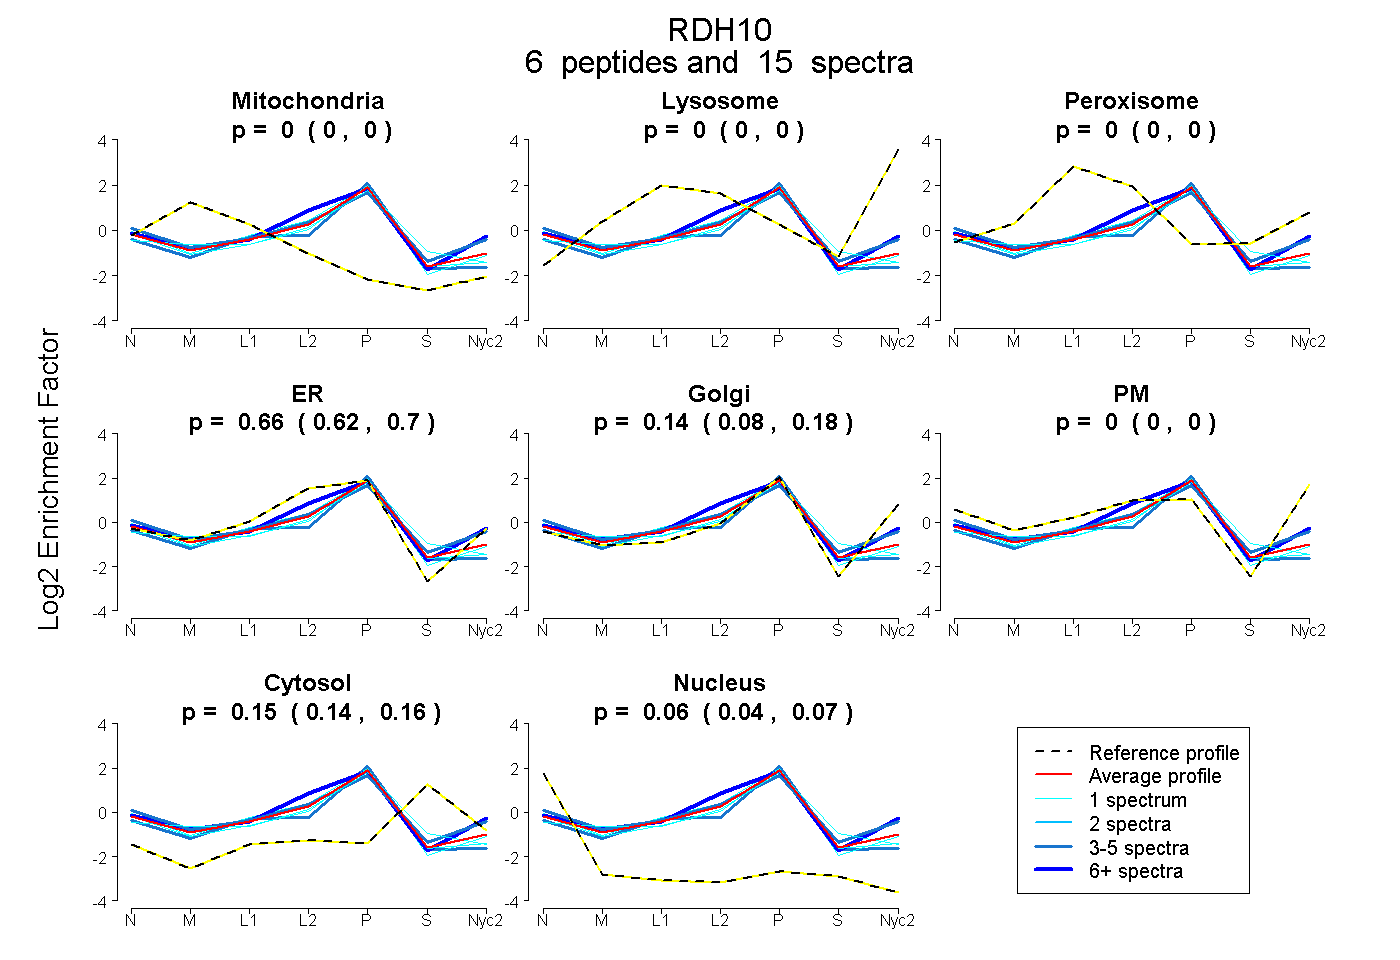
0.000 | 0.000
0.000 | 0.000
0.000 | 0.000
0.616 | 0.696
0.083 | 0.178
0.000 | 0.000
0.139 | 0.158
0.043 | 0.066
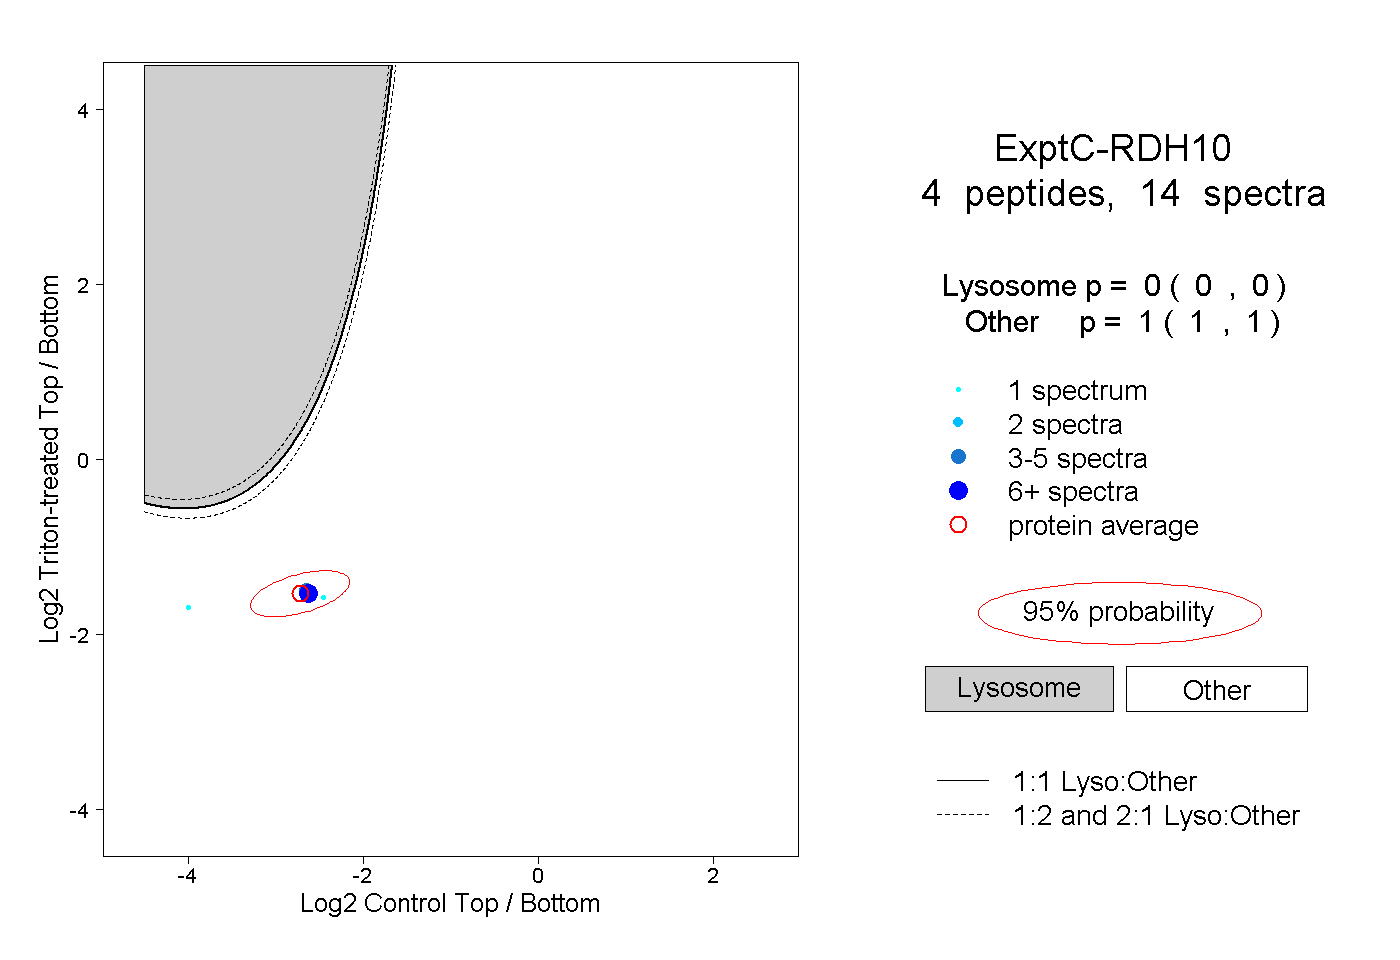
3peptides
spectra

0.000 | 0.196
0.120 | 0.325
0.000 | 0.306
0.183 | 0.620
0.000 | 0.126
0.000 | 0.057
0.000 | 0.021
4peptides
spectra
0.000 | 0.000
1.000 | 1.000
1peptide
spectra
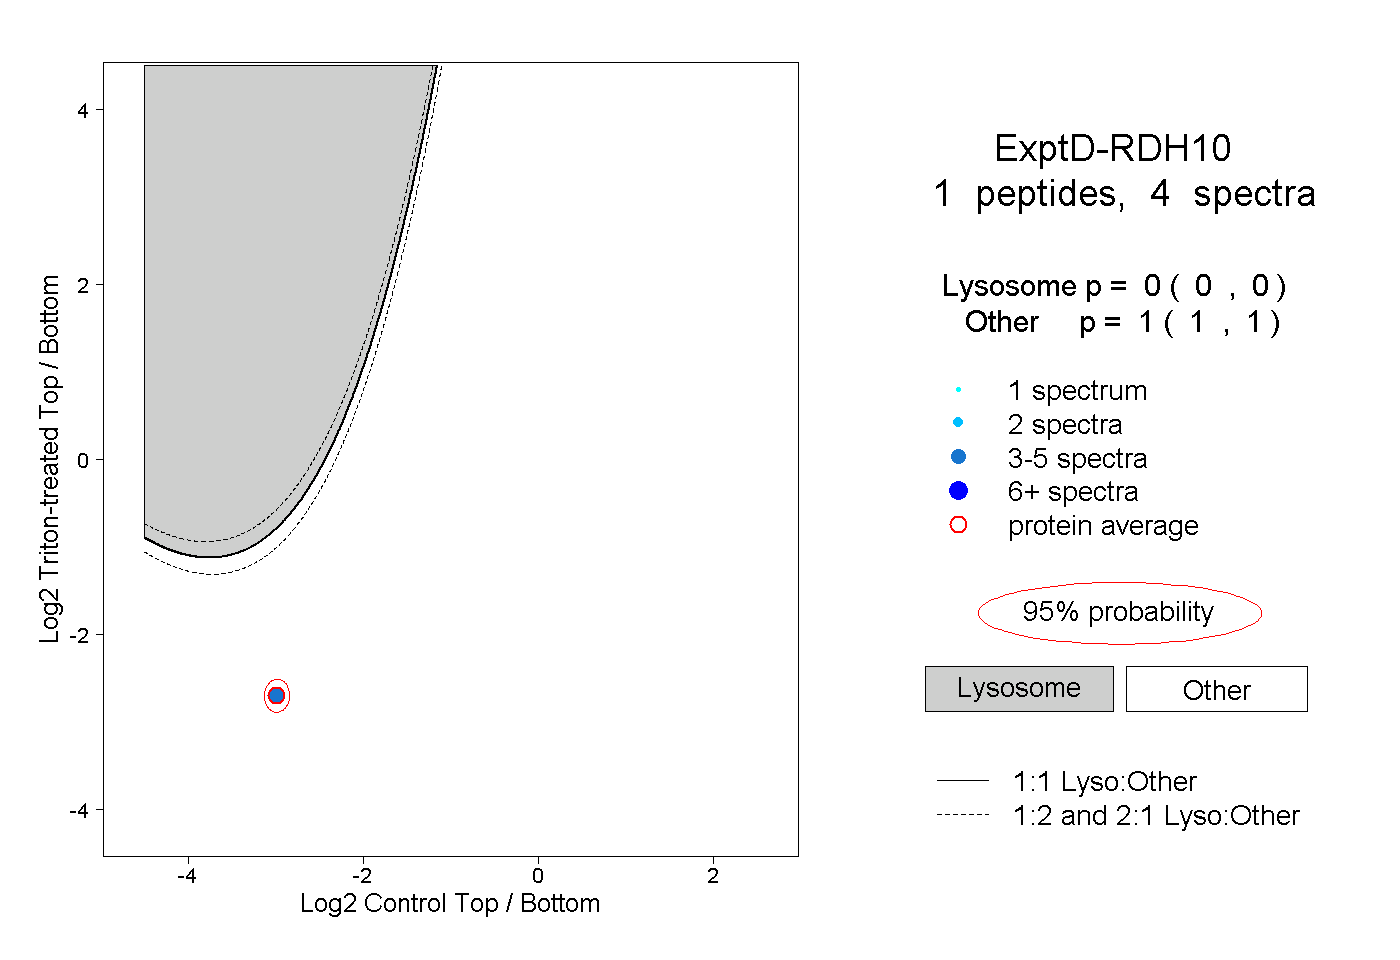
0.000 | 0.000
1.000 | 1.000