 6
6peptides
spectra
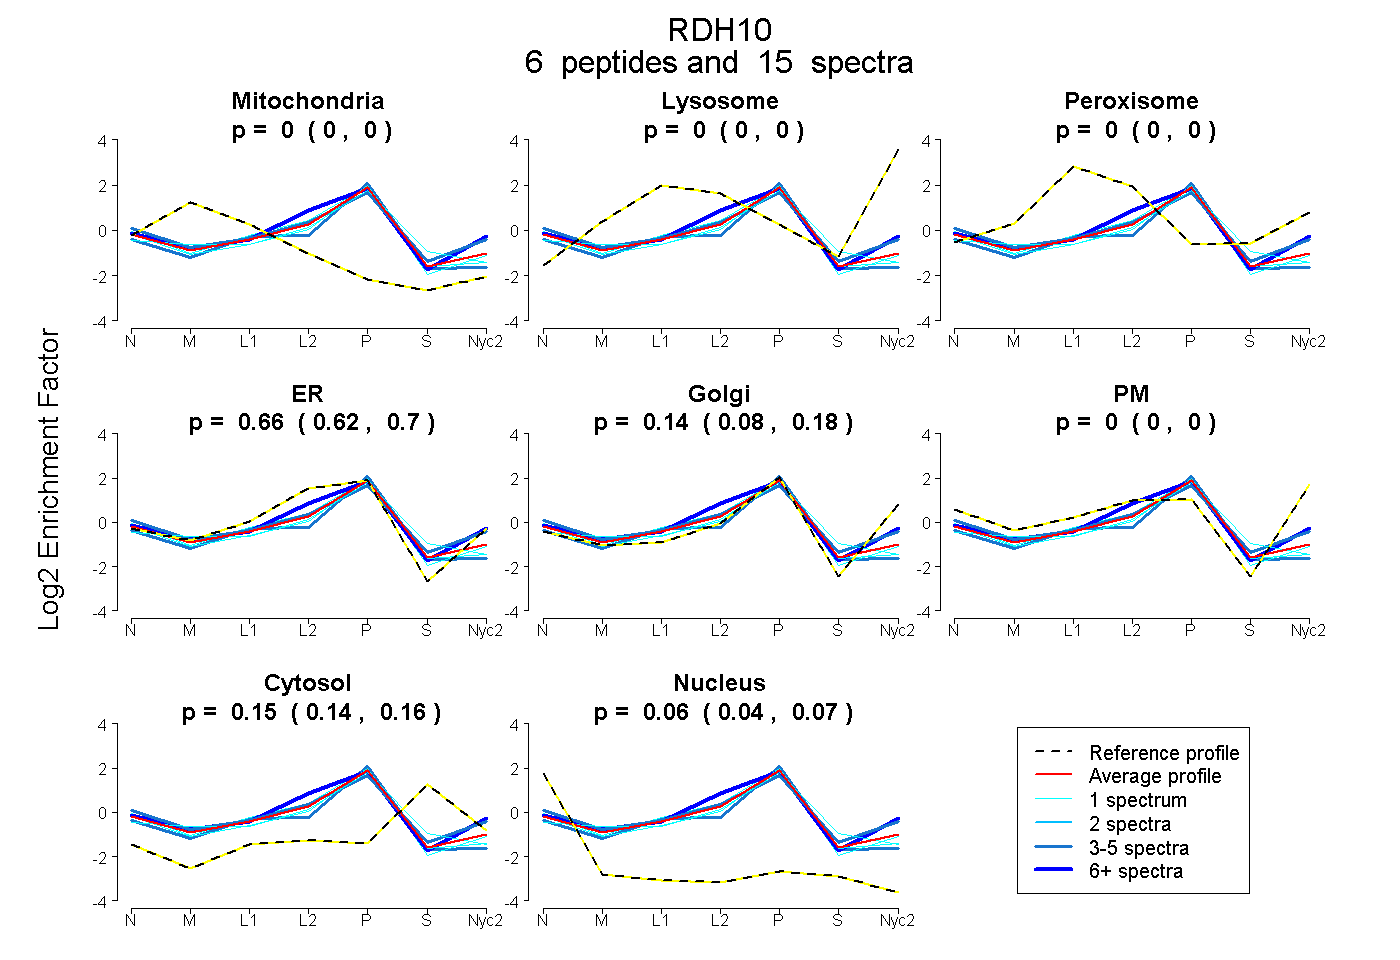
0.000 | 0.000
0.000 | 0.000
0.000 | 0.000
0.616 | 0.696
0.083 | 0.178
0.000 | 0.000
0.139 | 0.158
0.043 | 0.066
| Plot | Mito | Lyso | Perox | ER | Golgi | PM | Cytosol | Nucleus | |||||
| Expt A |
6 peptides |
15 spectra |
|
0.000 0.000 | 0.000 |
0.000 0.000 | 0.000 |
0.000 0.000 | 0.000 |
0.659 0.616 | 0.696 |
0.135 0.083 | 0.178 |
0.000 0.000 | 0.000 |
0.150 0.139 | 0.158 |
0.056 0.043 | 0.066 |
| 1 spectrum, TTLVCPYLVDTGMFR | 0.000 | 0.000 | 0.000 | 0.643 | 0.114 | 0.000 | 0.138 | 0.105 | ||
| 1 spectrum, ENVYLTAER | 0.000 | 0.000 | 0.000 | 0.761 | 0.070 | 0.000 | 0.082 | 0.086 | ||
| 3 spectra, CMYPFIAQR | 0.000 | 0.000 | 0.000 | 0.653 | 0.097 | 0.000 | 0.141 | 0.109 | ||
| 1 spectrum, TMMVNCHAHFWTTK | 0.027 | 0.000 | 0.000 | 0.644 | 0.033 | 0.000 | 0.274 | 0.022 | ||
| 6 spectra, LFALEFAR | 0.000 | 0.000 | 0.000 | 0.679 | 0.199 | 0.000 | 0.122 | 0.000 | ||
| 3 spectra, LMYIVTFMK | 0.019 | 0.000 | 0.019 | 0.517 | 0.268 | 0.000 | 0.166 | 0.012 |
| Plot | Mito | Lyso or Perox | ER | Golgi | PM | Cytosol | Nucleus | ||||||
| Expt B |
3 peptides |
8 spectra |
 |
0.101 0.000 | 0.196 |
0.258 0.120 | 0.325 |
0.114 0.000 | 0.306 |
0.499 0.183 | 0.620 |
0.028 0.000 | 0.126 |
0.000 0.000 | 0.057 |
0.000 0.000 | 0.021 |
|||
| Plot | Lyso | Other | |||||||||||
| Expt C |
4 peptides |
14 spectra |
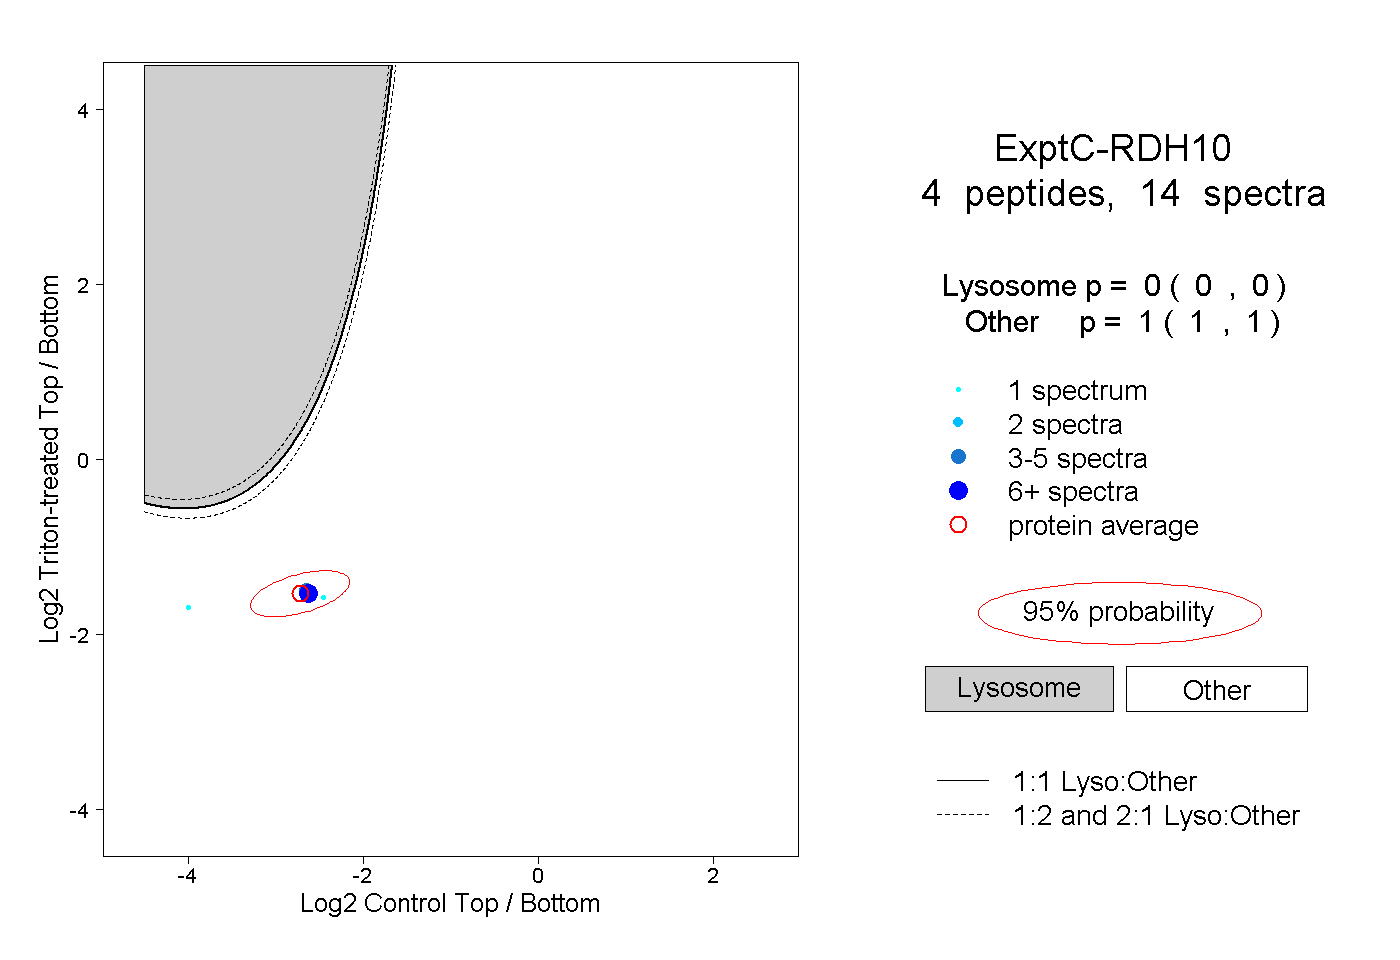 |
0.000 0.000 | 0.000 |
1.000 1.000 | 1.000 |
||||||||
| Plot | Lyso | Other | |||||||||||
| Expt D |
1 peptide |
4 spectra |
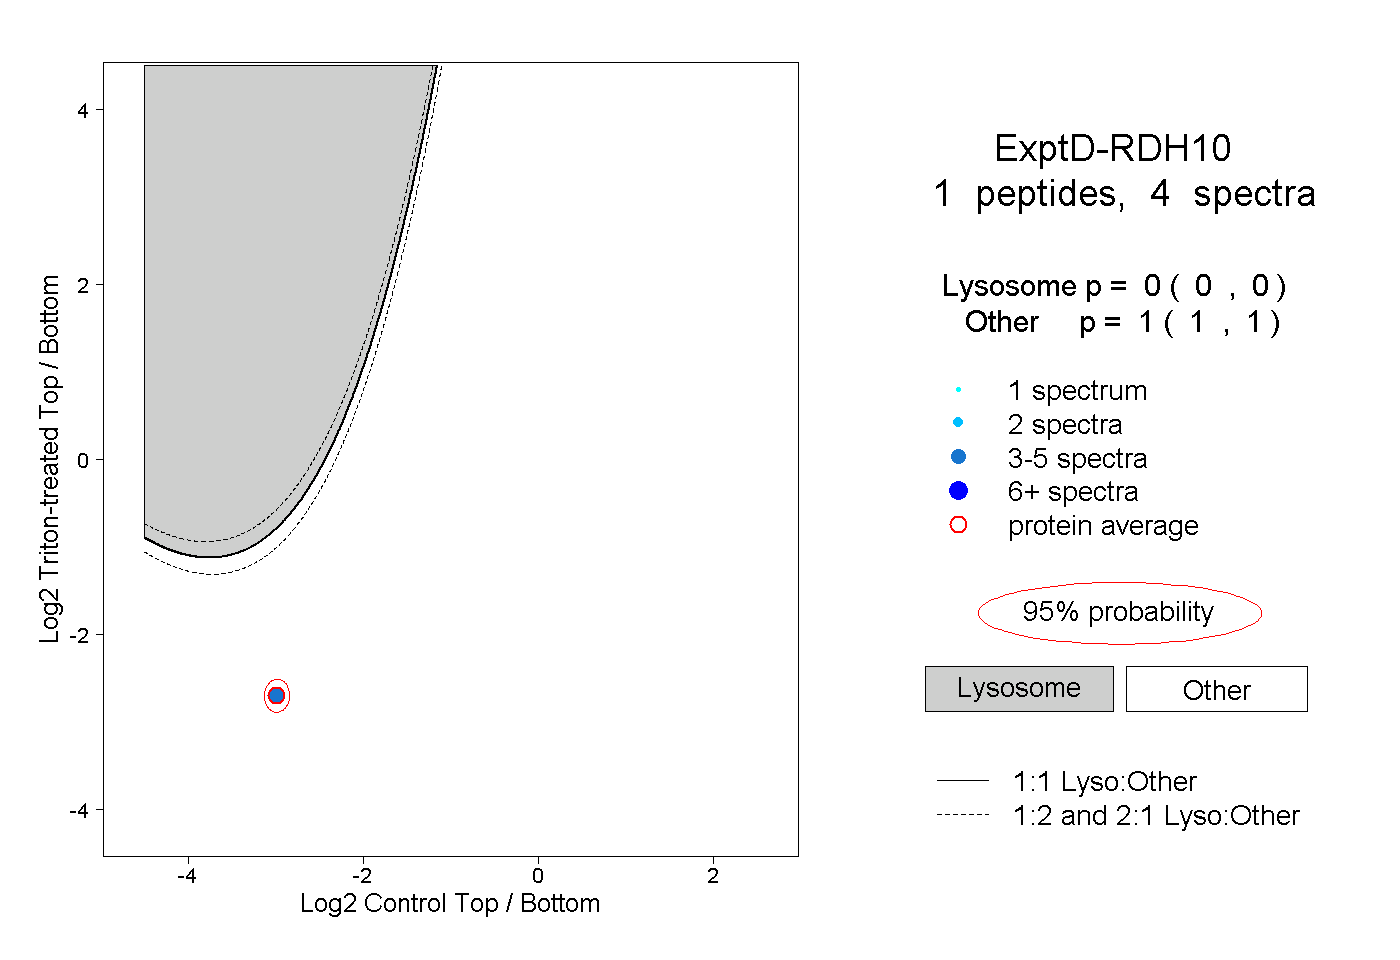 |
0.000 0.000 | 0.000 |
1.000 1.000 | 1.000 |