 8
8peptides
spectra

0.000 | 0.000
0.000 | 0.000
0.000 | 0.002
0.282 | 0.328
0.000 | 0.000
0.000 | 0.000
0.282 | 0.324
0.360 | 0.405
1peptide
spectra
NA | NA
NA | NA
| Plot | Mito | Lyso | Perox | ER | Golgi | PM | Cytosol | Nucleus | |||||
| Expt A |
8 peptides |
12 spectra |
|
0.000 0.000 | 0.000 |
0.000 0.000 | 0.000 |
0.000 0.000 | 0.002 |
0.310 0.282 | 0.328 |
0.000 0.000 | 0.000 |
0.000 0.000 | 0.000 |
0.305 0.282 | 0.324 |
0.385 0.360 | 0.405 |
||
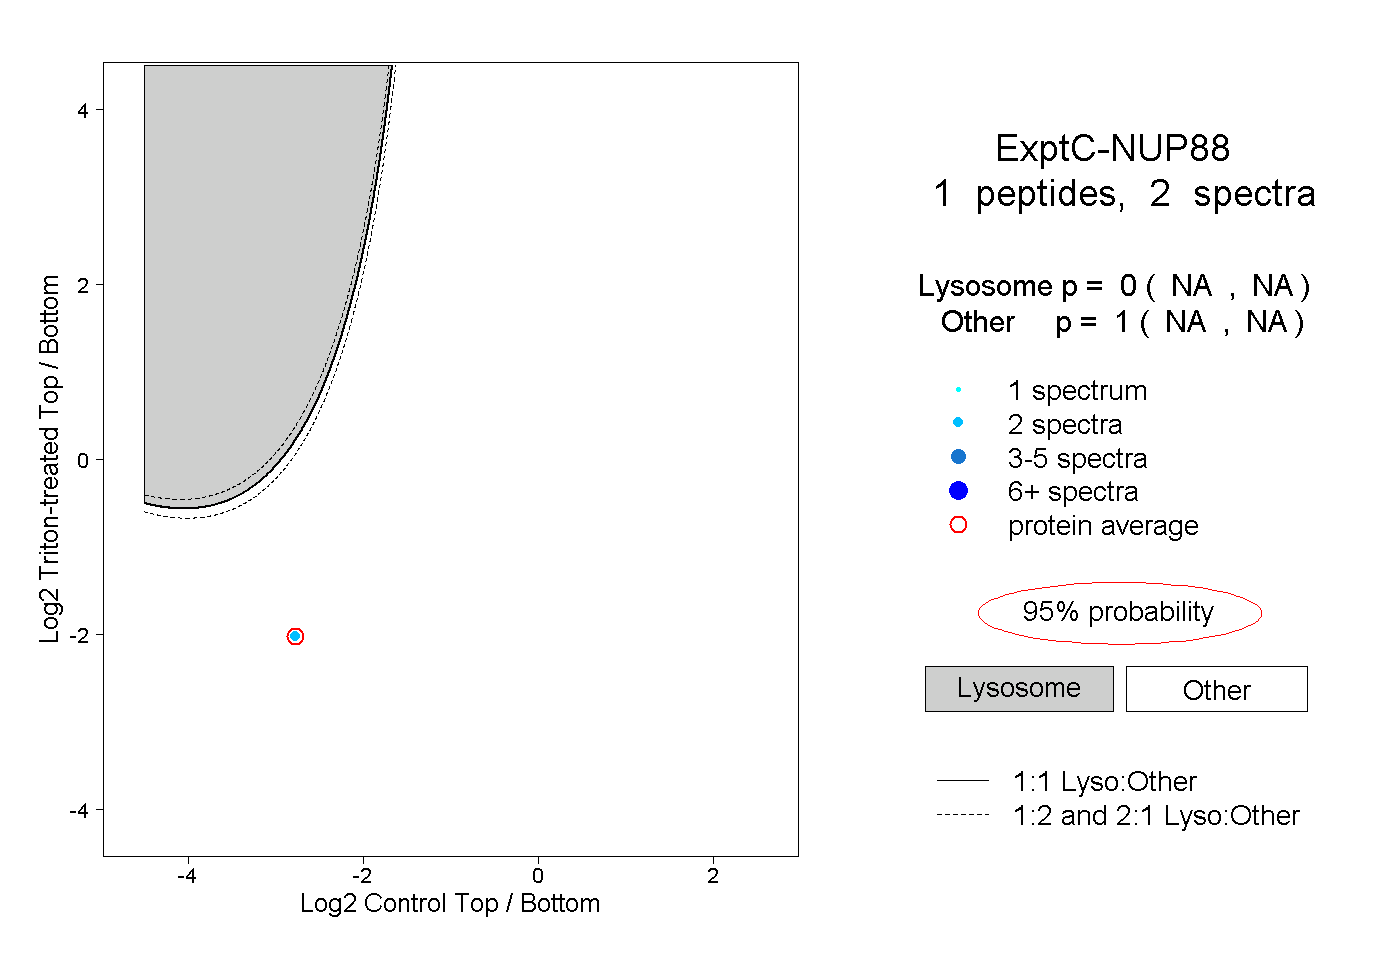
| Plot | Lyso | Other | |||||||||||
| Expt C |
1 peptide |
2 spectra |
|
0.000 NA | NA |
1.000 NA | NA |