 8
8peptides
spectra

0.000 | 0.000
0.000 | 0.000
0.000 | 0.002
0.282 | 0.328
0.000 | 0.000
0.000 | 0.000
0.282 | 0.324
0.360 | 0.405
| Plot | Mito | Lyso | Perox | ER | Golgi | PM | Cytosol | Nucleus | |||||
| Expt A |
8 peptides |
12 spectra |
|
0.000 0.000 | 0.000 |
0.000 0.000 | 0.000 |
0.000 0.000 | 0.002 |
0.310 0.282 | 0.328 |
0.000 0.000 | 0.000 |
0.000 0.000 | 0.000 |
0.305 0.282 | 0.324 |
0.385 0.360 | 0.405 |
| 1 spectrum, QPAPIR | 0.000 | 0.000 | 0.000 | 0.218 | 0.000 | 0.000 | 0.322 | 0.460 | ||
| 1 spectrum, EEGEHIR | 0.000 | 0.000 | 0.000 | 0.396 | 0.000 | 0.000 | 0.110 | 0.494 | ||
| 1 spectrum, ILAEAPDSFEK | 0.171 | 0.000 | 0.000 | 0.156 | 0.000 | 0.000 | 0.148 | 0.525 | ||
| 1 spectrum, ATVNCSTIPIAER | 0.000 | 0.000 | 0.000 | 0.169 | 0.000 | 0.000 | 0.182 | 0.649 | ||
| 2 spectra, GLMALELPQR | 0.000 | 0.000 | 0.000 | 0.026 | 0.000 | 0.000 | 0.502 | 0.473 | ||
| 2 spectra, EQYILK | 0.000 | 0.000 | 0.000 | 0.310 | 0.069 | 0.033 | 0.376 | 0.212 | ||
| 2 spectra, EDAGVAESPLR | 0.000 | 0.000 | 0.000 | 0.000 | 0.043 | 0.271 | 0.294 | 0.392 | ||
| 2 spectra, SAANPALLK | 0.000 | 0.000 | 0.335 | 0.270 | 0.145 | 0.000 | 0.089 | 0.161 |
| Plot | Lyso | Other | |||||||||||
| Expt C |
1 peptide |
2 spectra |
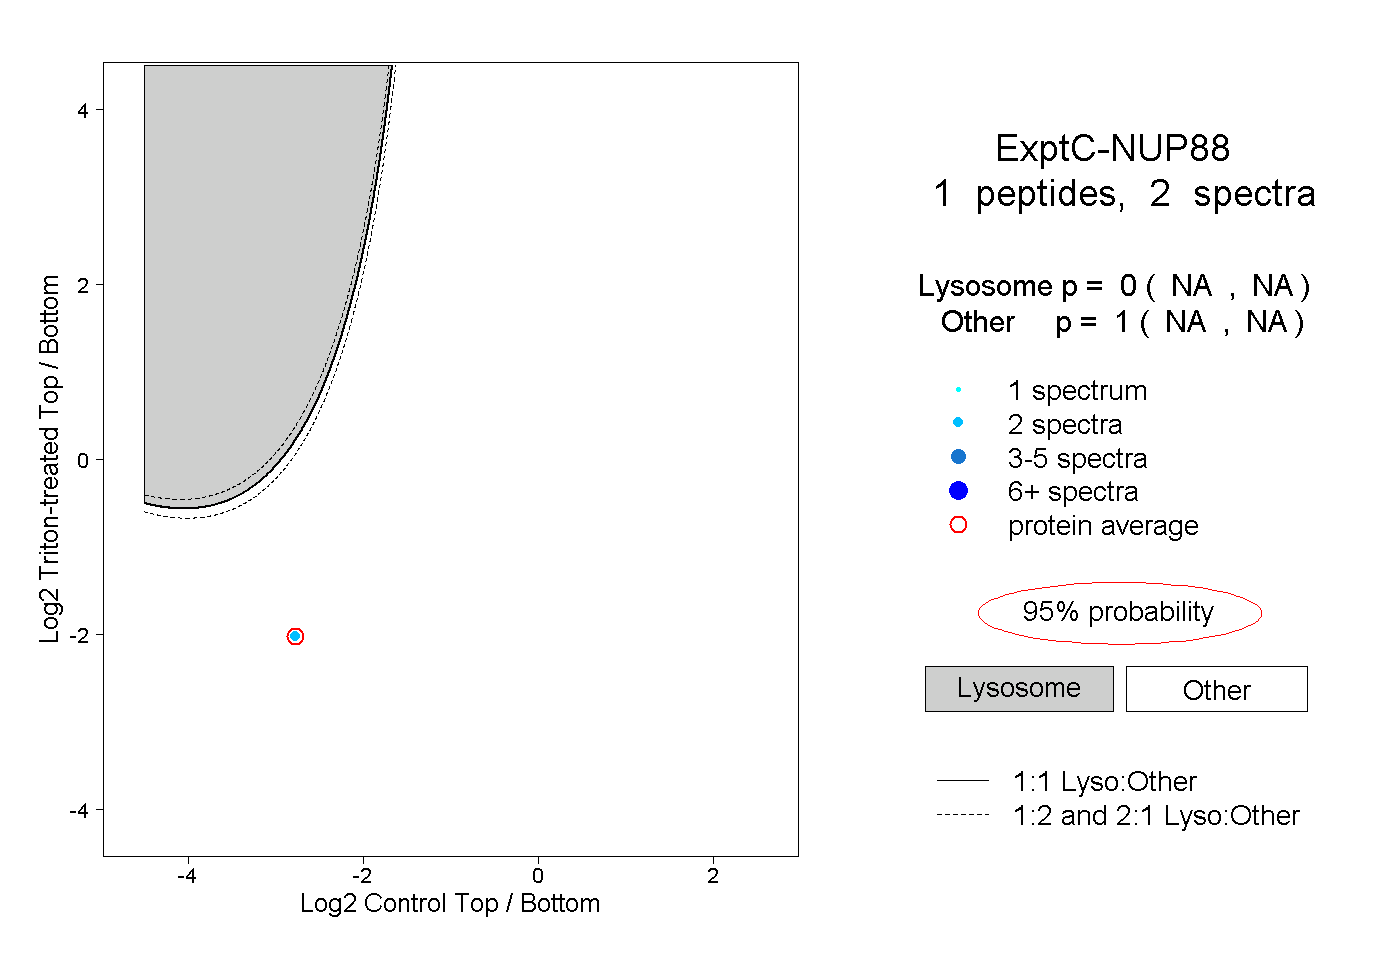 |
0.000 NA | NA |
1.000 NA | NA |