 6
6peptides
spectra
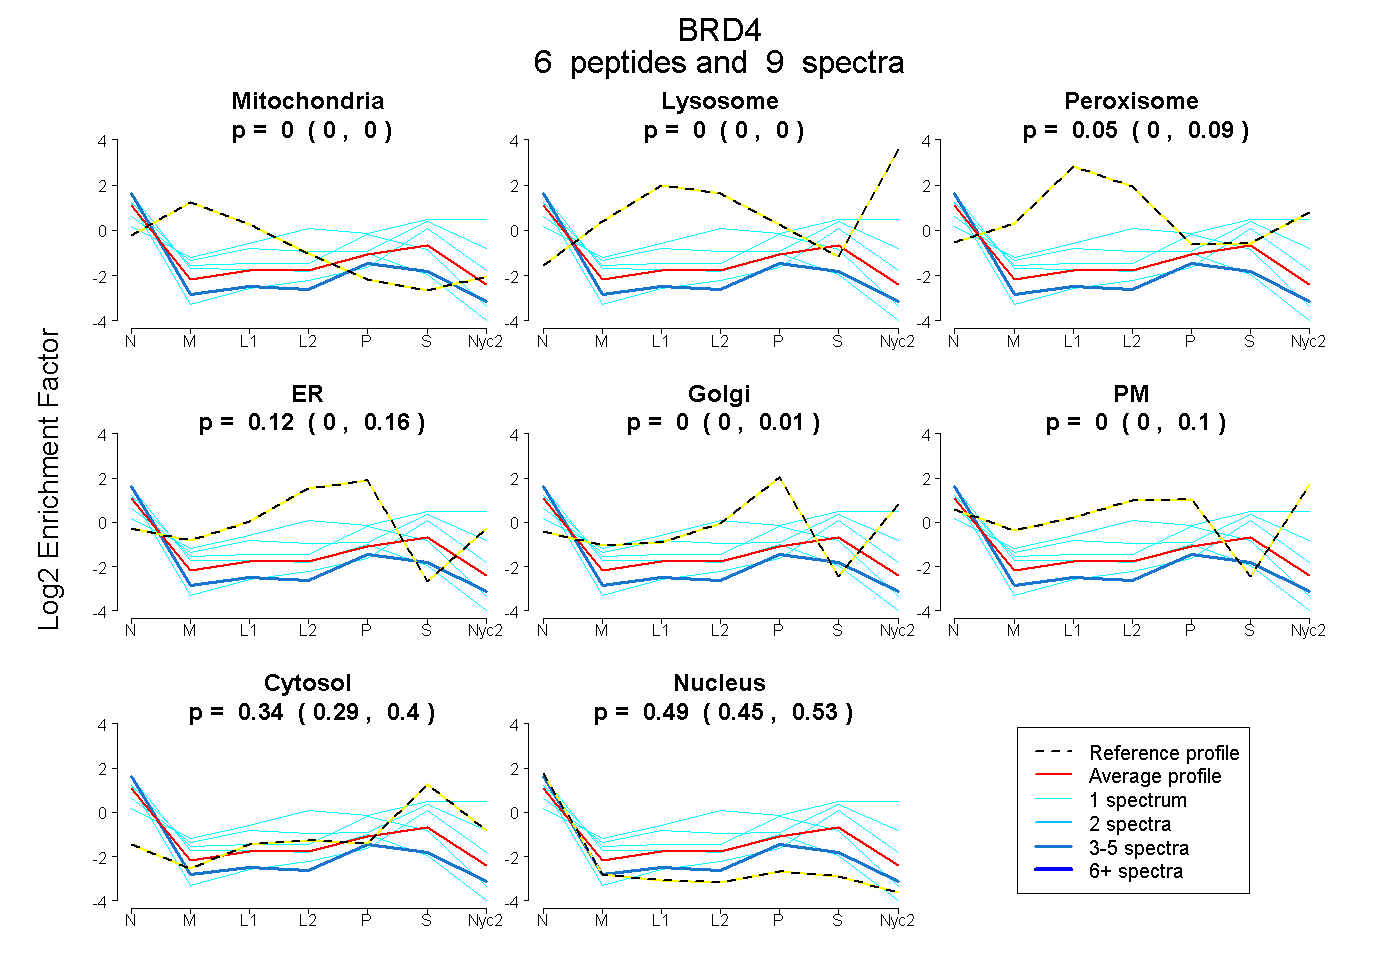
0.000 | 0.000
0.000 | 0.000
0.000 | 0.094
0.000 | 0.161
0.000 | 0.010
0.000 | 0.096
0.286 | 0.403
0.447 | 0.527
1peptide
spectra
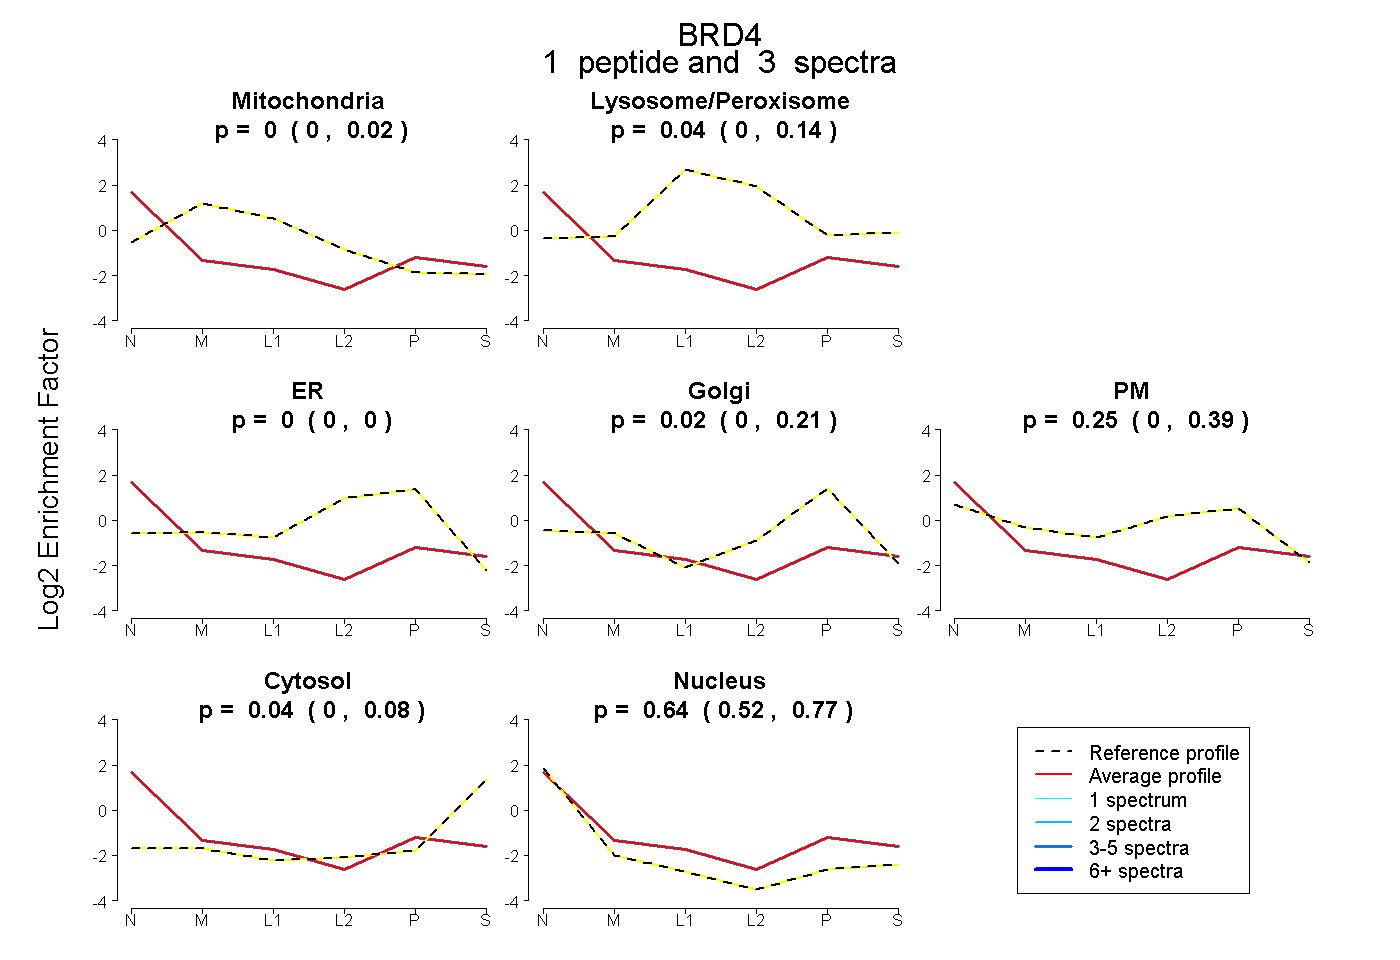
0.000 | 0.019
0.000 | 0.140
0.000 | 0.000
0.000 | 0.213
0.000 | 0.394
0.000 | 0.076
0.521 | 0.766