 6
6peptides
spectra
0.000 | 0.000
0.000 | 0.000
0.000 | 0.094
0.000 | 0.161
0.000 | 0.010
0.000 | 0.096
0.286 | 0.403
0.447 | 0.527
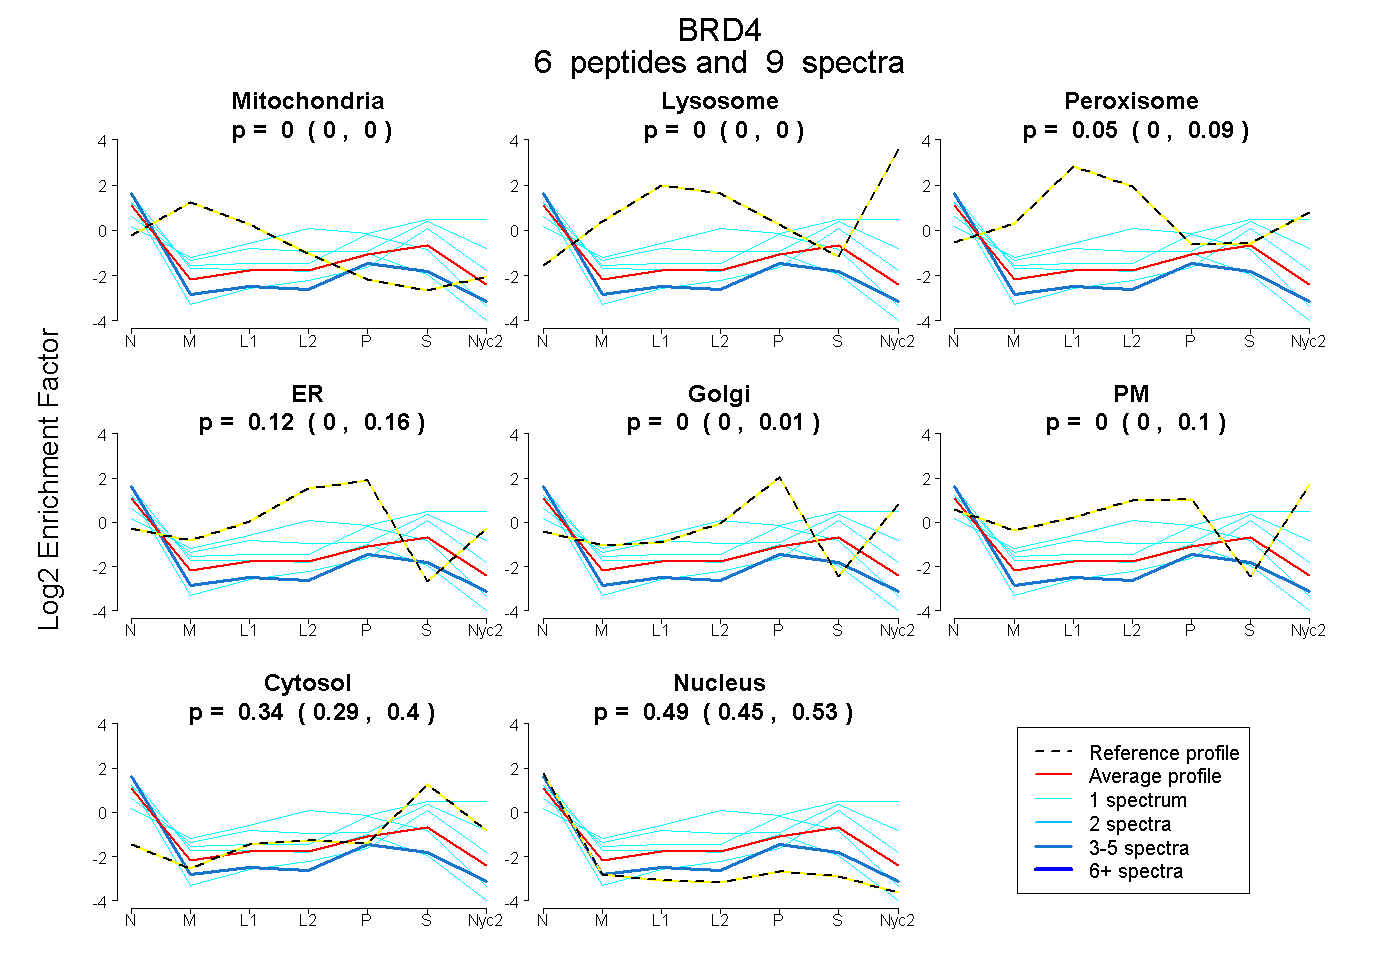
| Plot | Mito | Lyso | Perox | ER | Golgi | PM | Cytosol | Nucleus | |||||
| Expt A |
6 peptides |
9 spectra |
|
0.000 0.000 | 0.000 |
0.000 0.000 | 0.000 |
0.046 0.000 | 0.094 |
0.119 0.000 | 0.161 |
0.000 0.000 | 0.010 |
0.000 0.000 | 0.096 |
0.345 0.286 | 0.403 |
0.491 0.447 | 0.527 |
| 1 spectrum, LNLPDYYK | 0.000 | 0.000 | 0.099 | 0.000 | 0.000 | 0.386 | 0.516 | 0.000 | ||
| 1 spectrum, LMFSNCYK | 0.103 | 0.000 | 0.000 | 0.207 | 0.000 | 0.000 | 0.013 | 0.677 | ||
| 1 spectrum, YNPPDHEVVAMAR | 0.000 | 0.000 | 0.185 | 0.000 | 0.000 | 0.131 | 0.482 | 0.201 | ||
| 4 spectra, VVHIIQSR | 0.000 | 0.000 | 0.000 | 0.063 | 0.029 | 0.000 | 0.149 | 0.759 | ||
| 1 spectrum, DAQEFGADVR | 0.000 | 0.000 | 0.000 | 0.000 | 0.000 | 0.000 | 0.532 | 0.468 | ||
| 1 spectrum, DVPDSQQHPGPEK | 0.026 | 0.000 | 0.000 | 0.282 | 0.000 | 0.000 | 0.214 | 0.478 |
| Plot | Mito | Lyso or Perox | ER | Golgi | PM | Cytosol | Nucleus | ||||||
| Expt B |
1 peptide |
3 spectra |
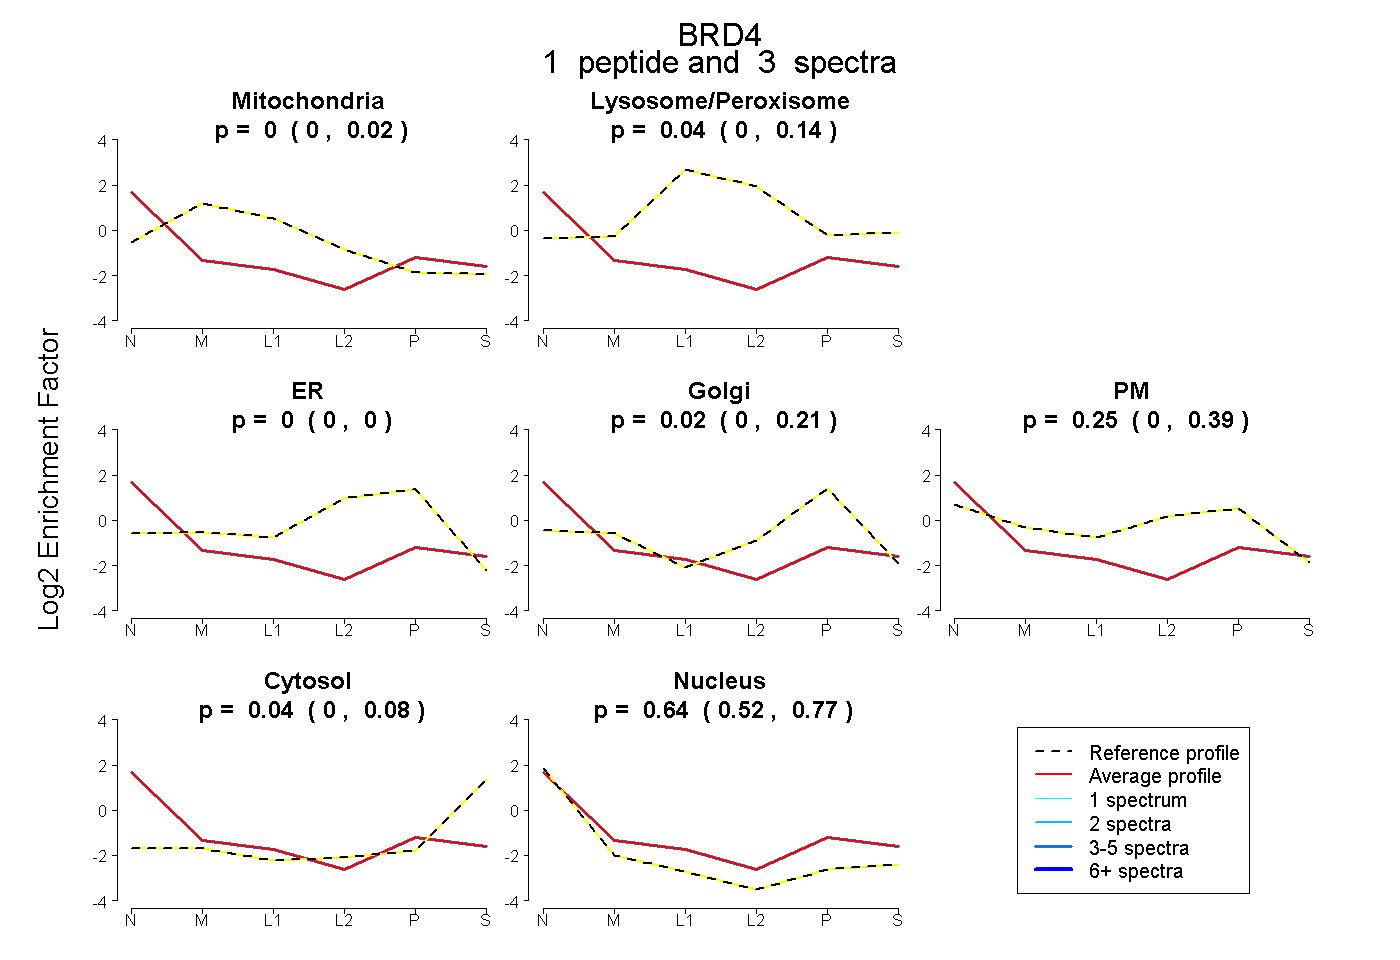 |
0.000 0.000 | 0.019 |
0.043 0.000 | 0.140 |
0.000 0.000 | 0.000 |
0.024 0.000 | 0.213 |
0.254 0.000 | 0.394 |
0.036 0.000 | 0.076 |
0.644 0.521 | 0.766 |