 13
13peptides
spectra
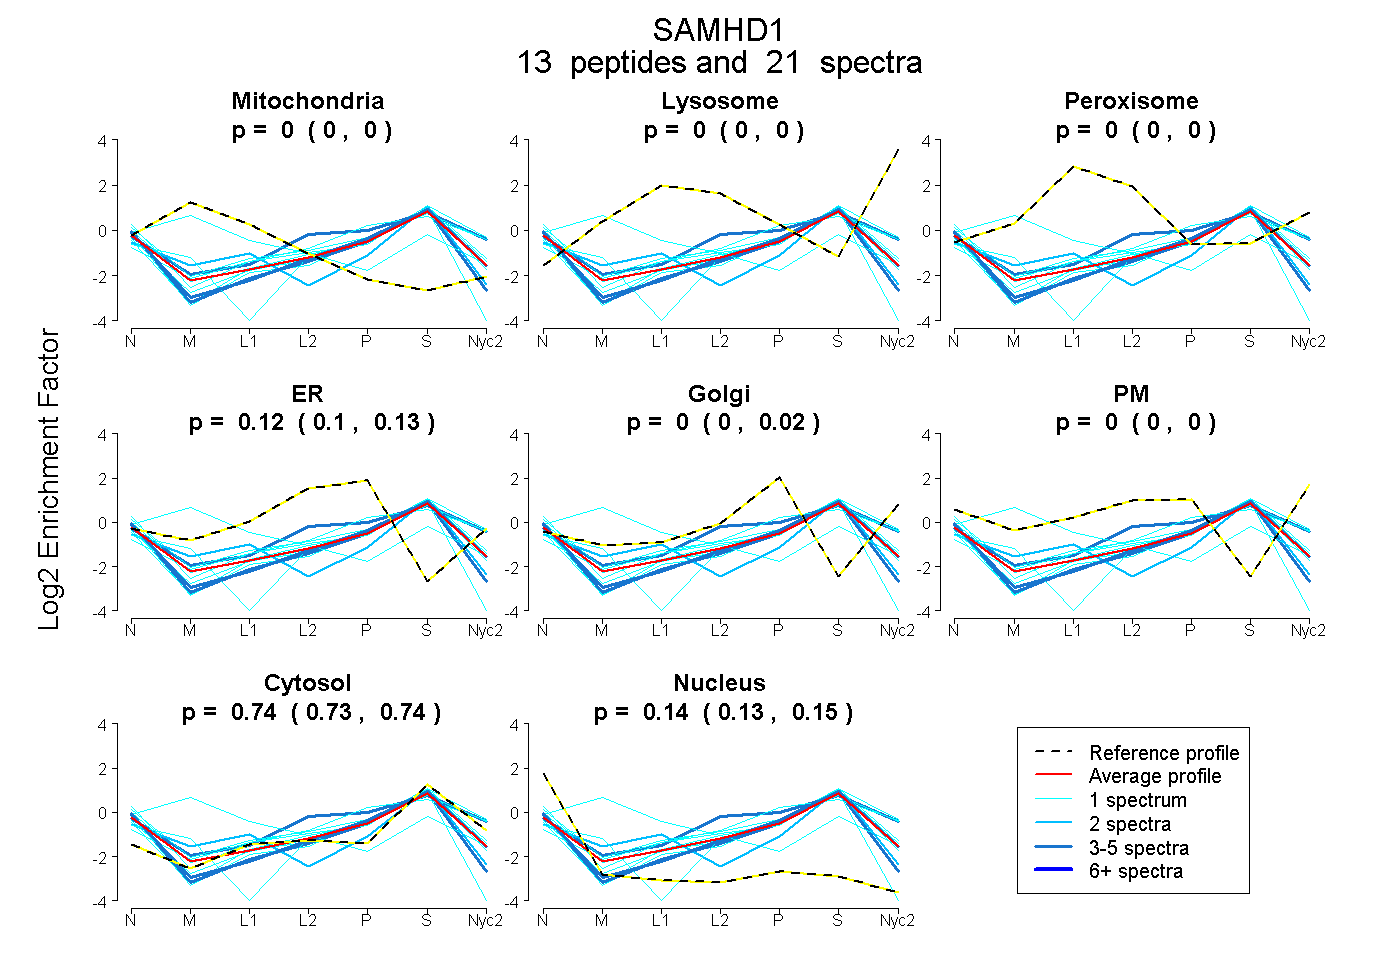
0.000 | 0.000
0.000 | 0.000
0.000 | 0.000
0.097 | 0.134
0.000 | 0.019
0.000 | 0.000
0.727 | 0.745
0.126 | 0.148
4peptides
spectra
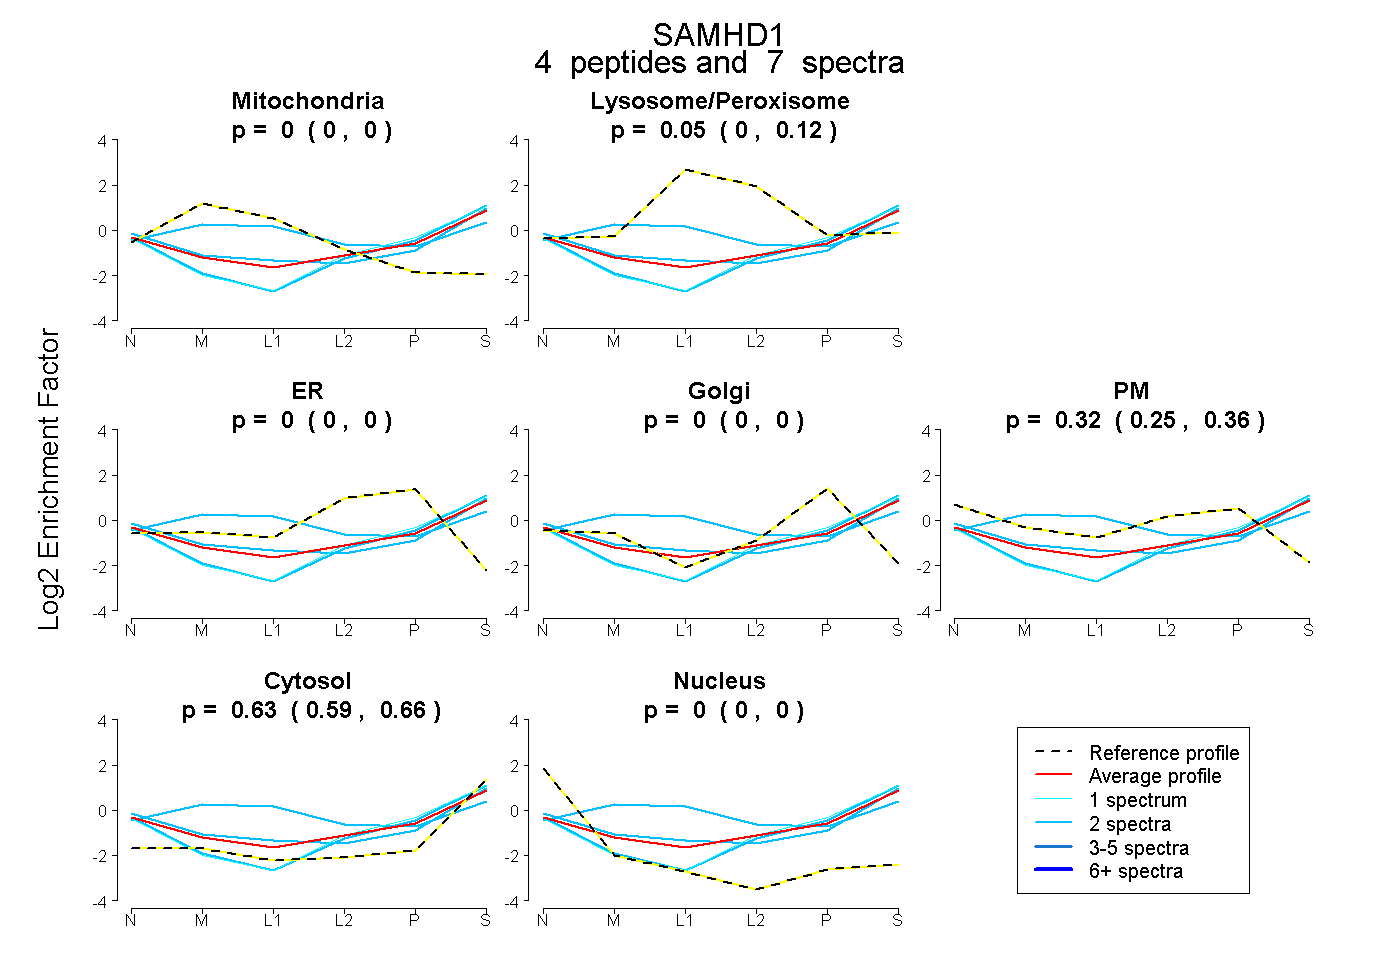
0.000 | 0.000
0.000 | 0.125
0.000 | 0.000
0.000 | 0.000
0.252 | 0.364
0.587 | 0.655
0.000 | 0.000
7peptides
spectra
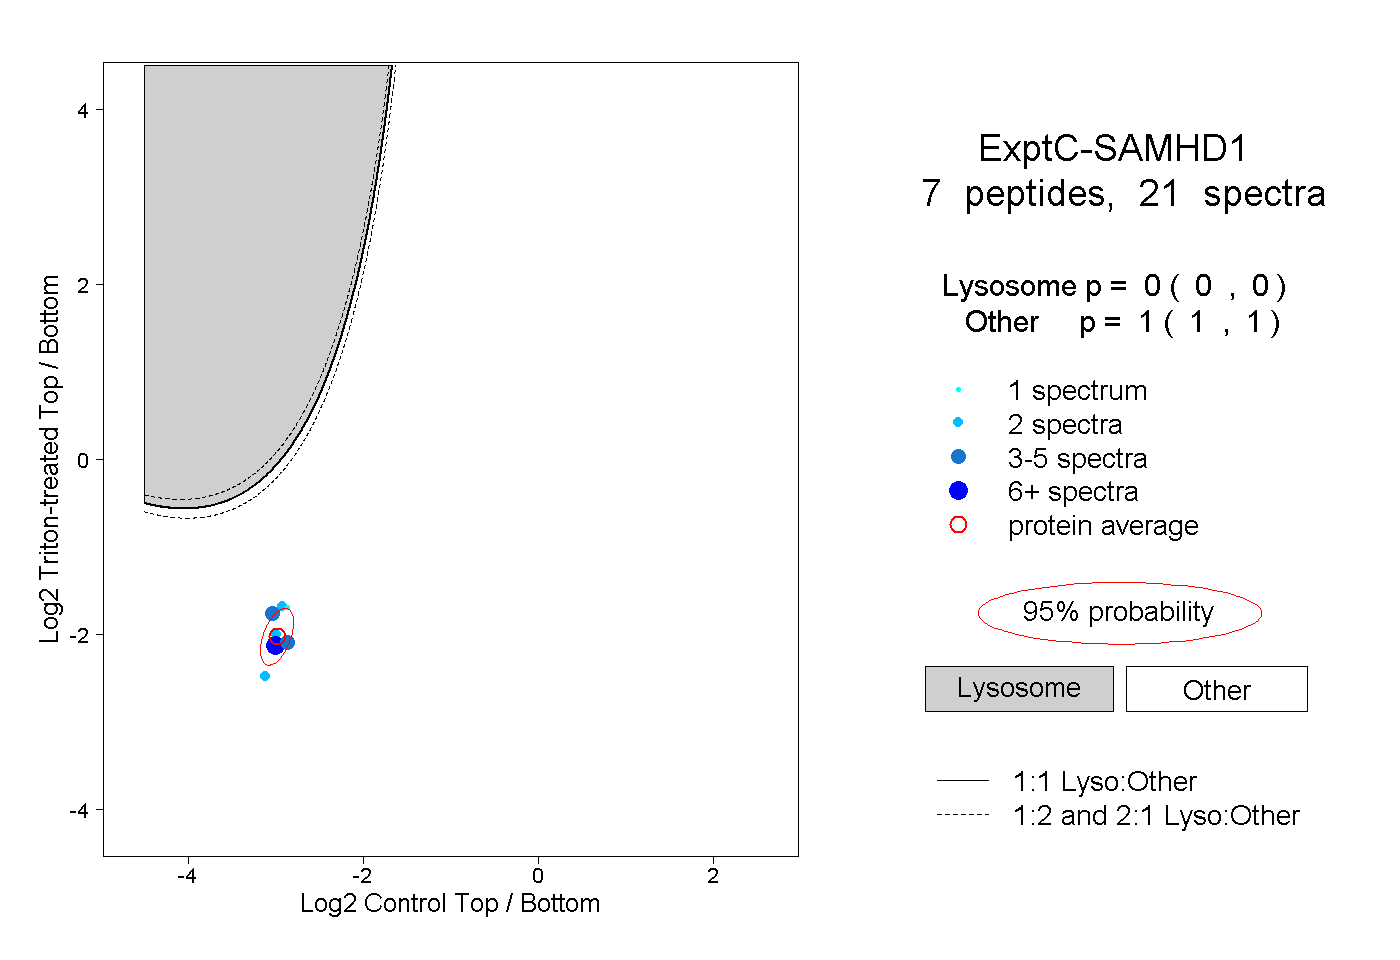
0.000 | 0.000
1.000 | 1.000
3peptides
spectra
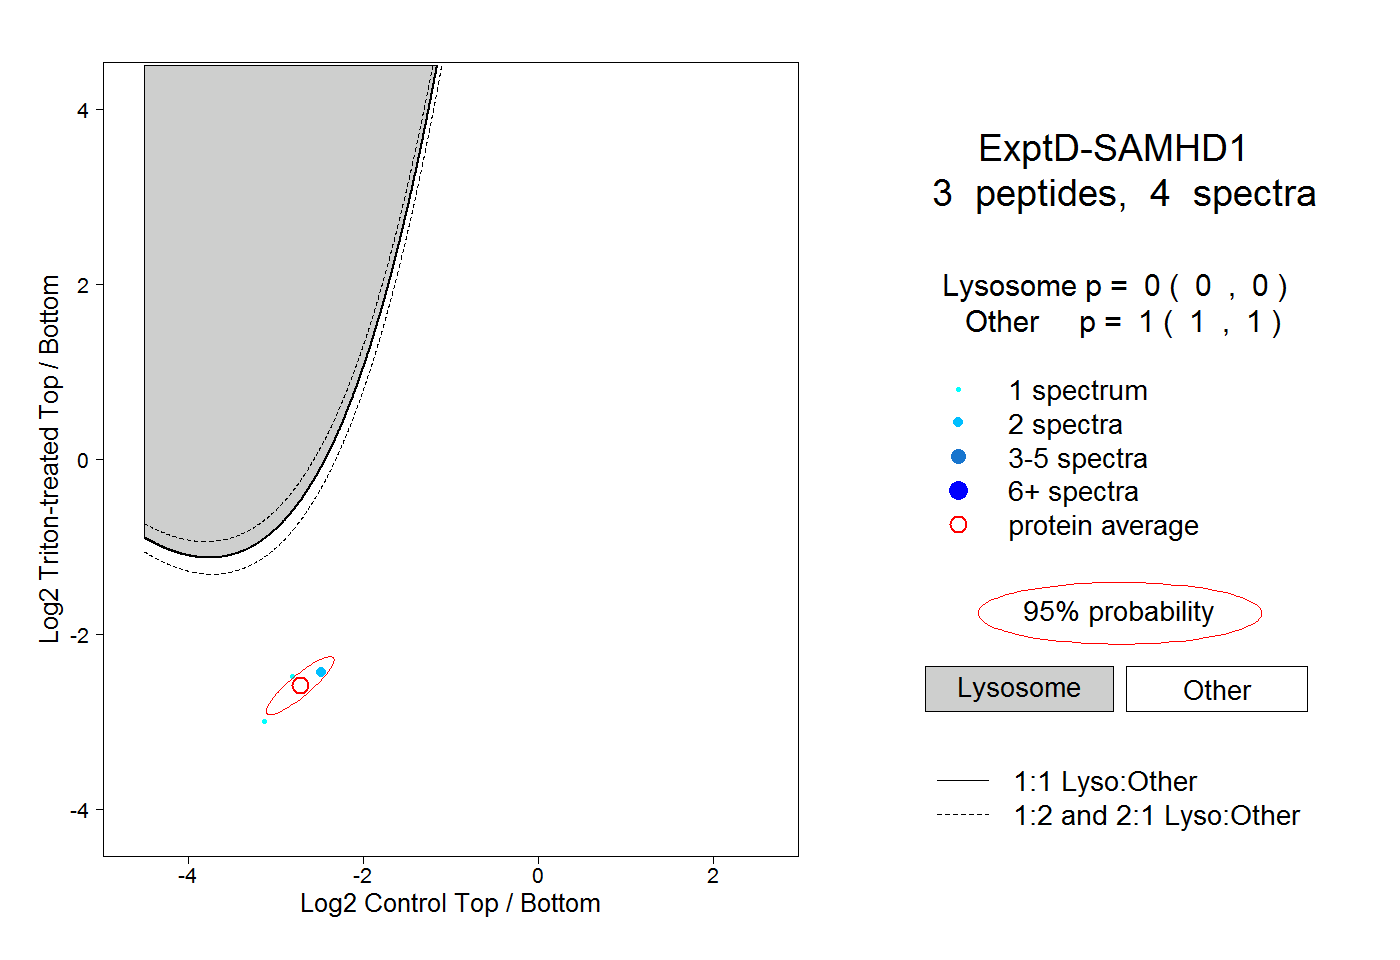
0.000 | 0.000
1.000 | 1.000