 20
20peptides
spectra
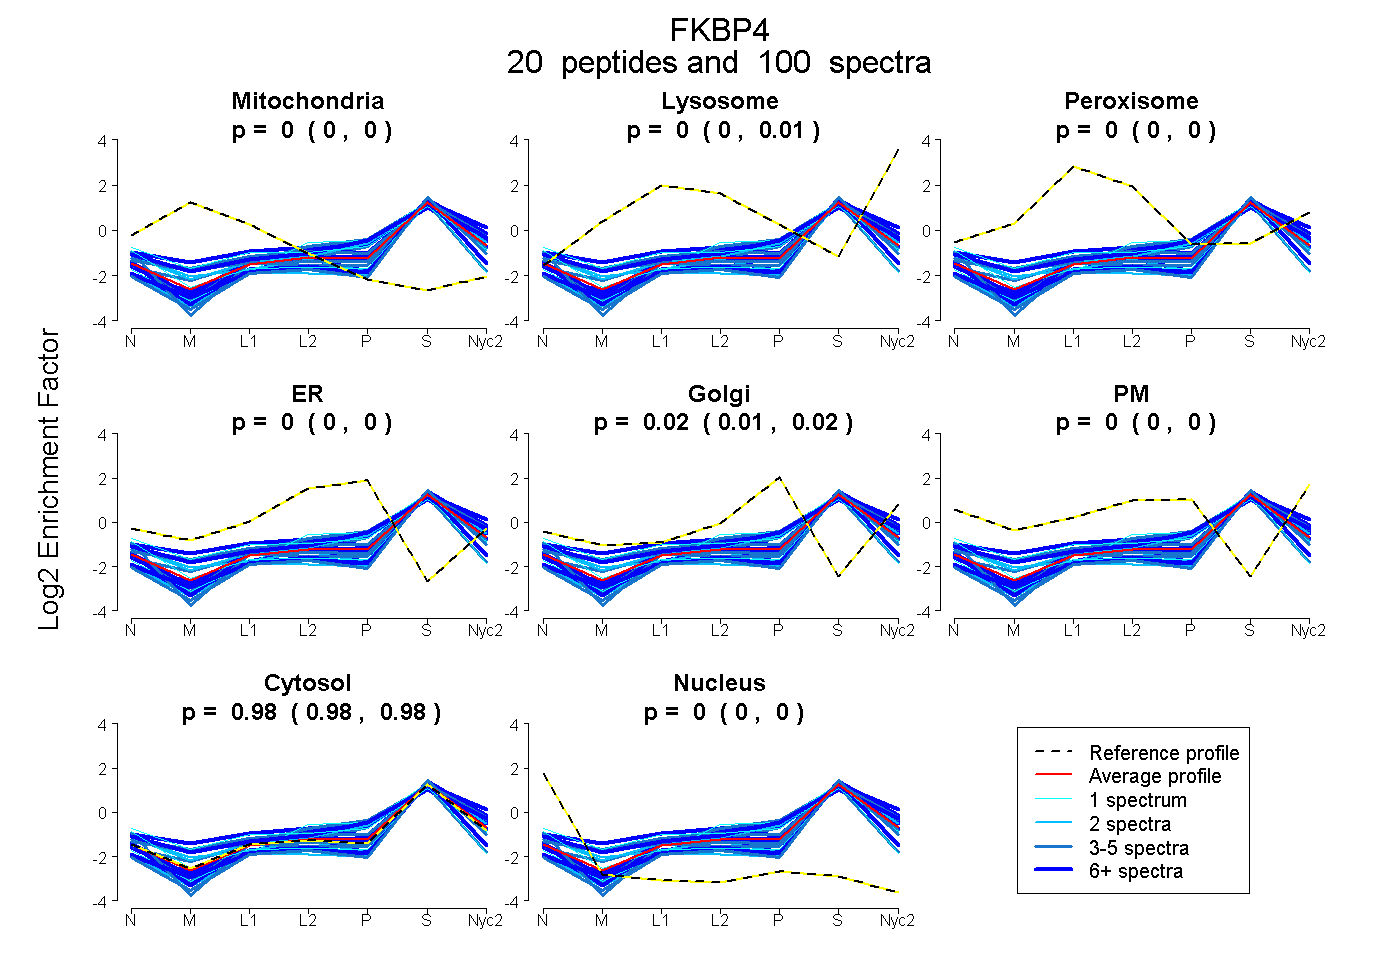
0.000 | 0.000
0.000 | 0.008
0.000 | 0.000
0.000 | 0.000
0.012 | 0.020
0.000 | 0.000
0.976 | 0.982
0.000 | 0.000
12peptides
spectra
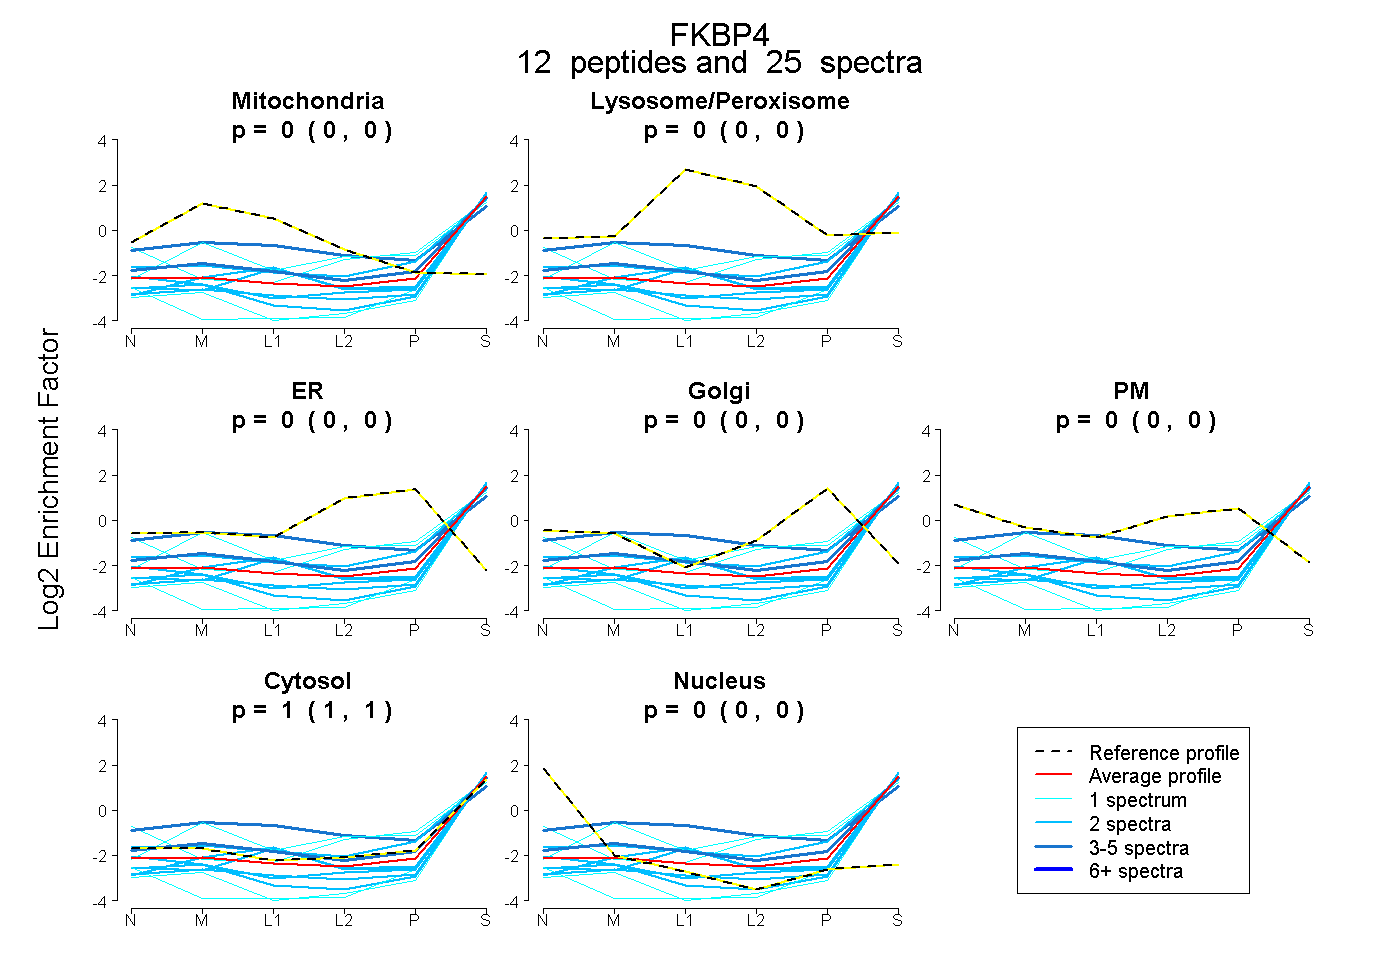
0.000 | 0.000
0.000 | 0.000
0.000 | 0.000
0.000 | 0.000
0.000 | 0.000
1.000 | 1.000
0.000 | 0.000
16peptides
spectra
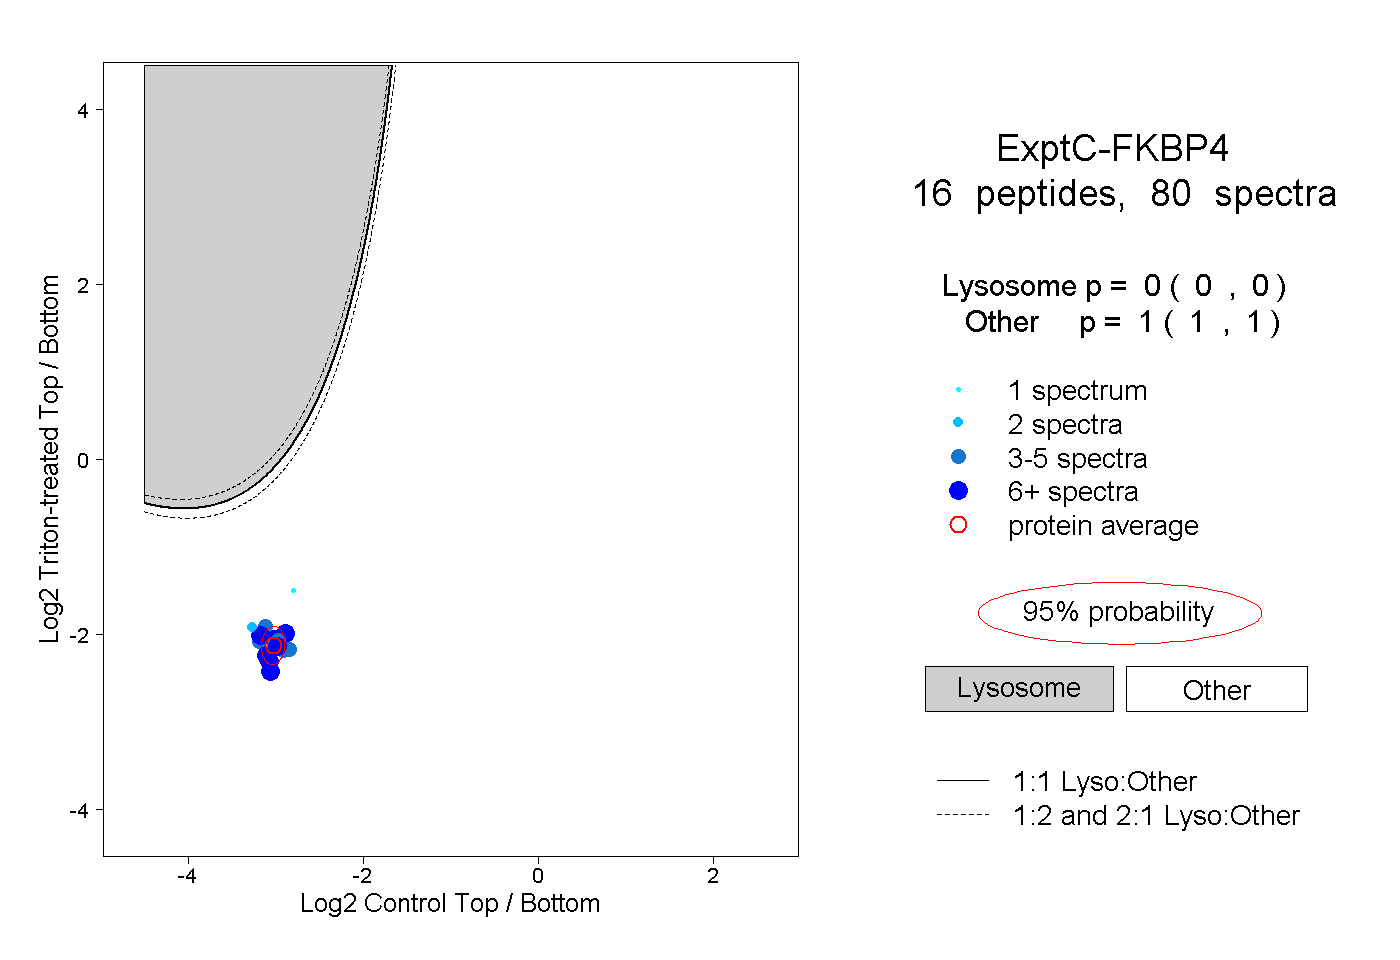
0.000 | 0.000
1.000 | 1.000
3peptides
spectra
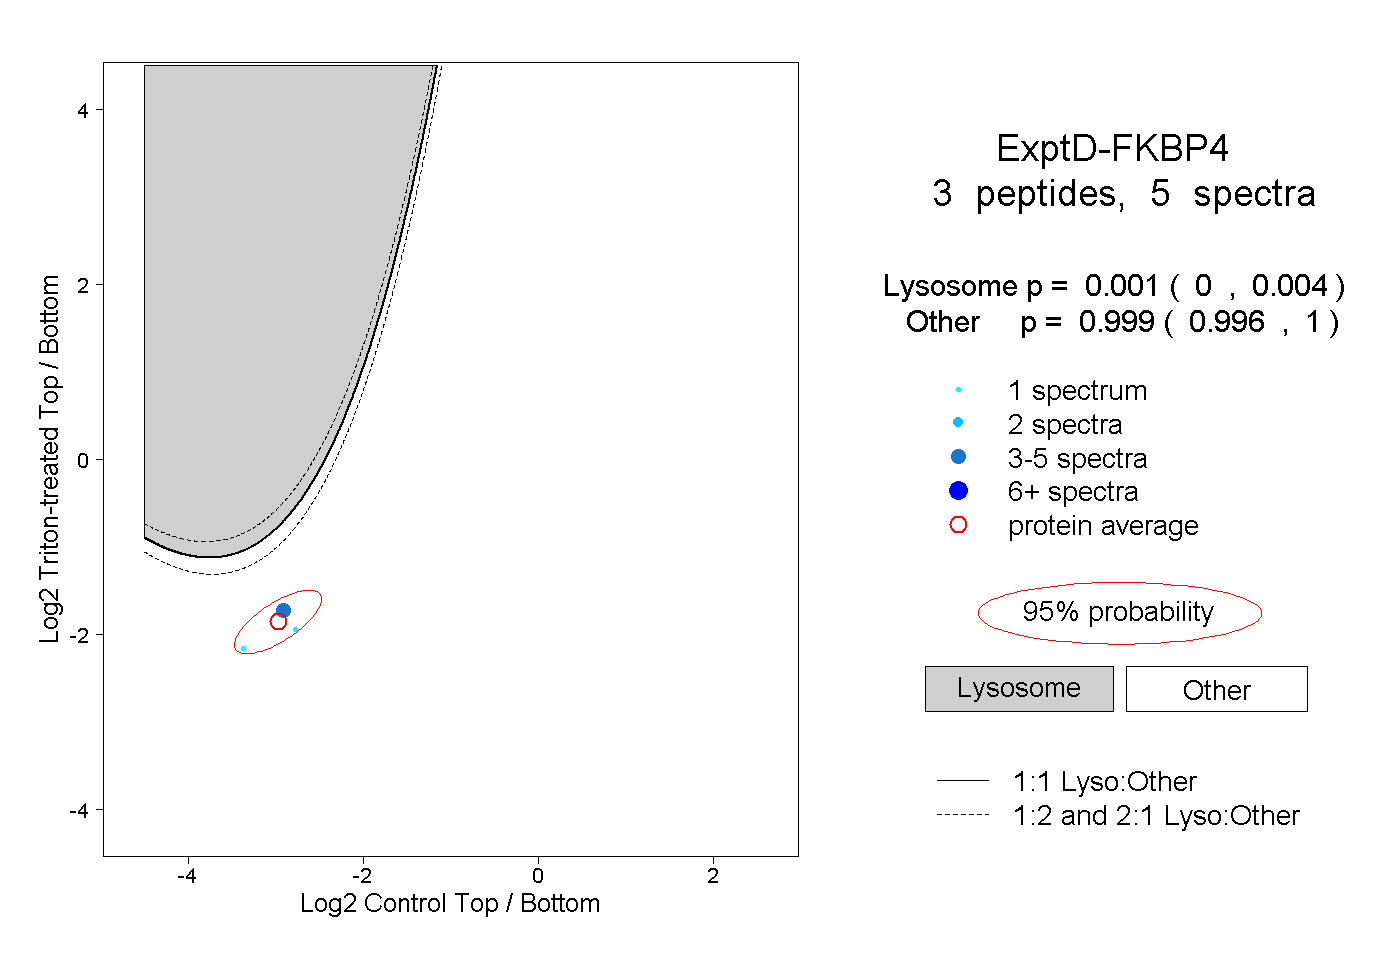
0.000 | 0.004
0.996 | 1.000