 10
10peptides
spectra
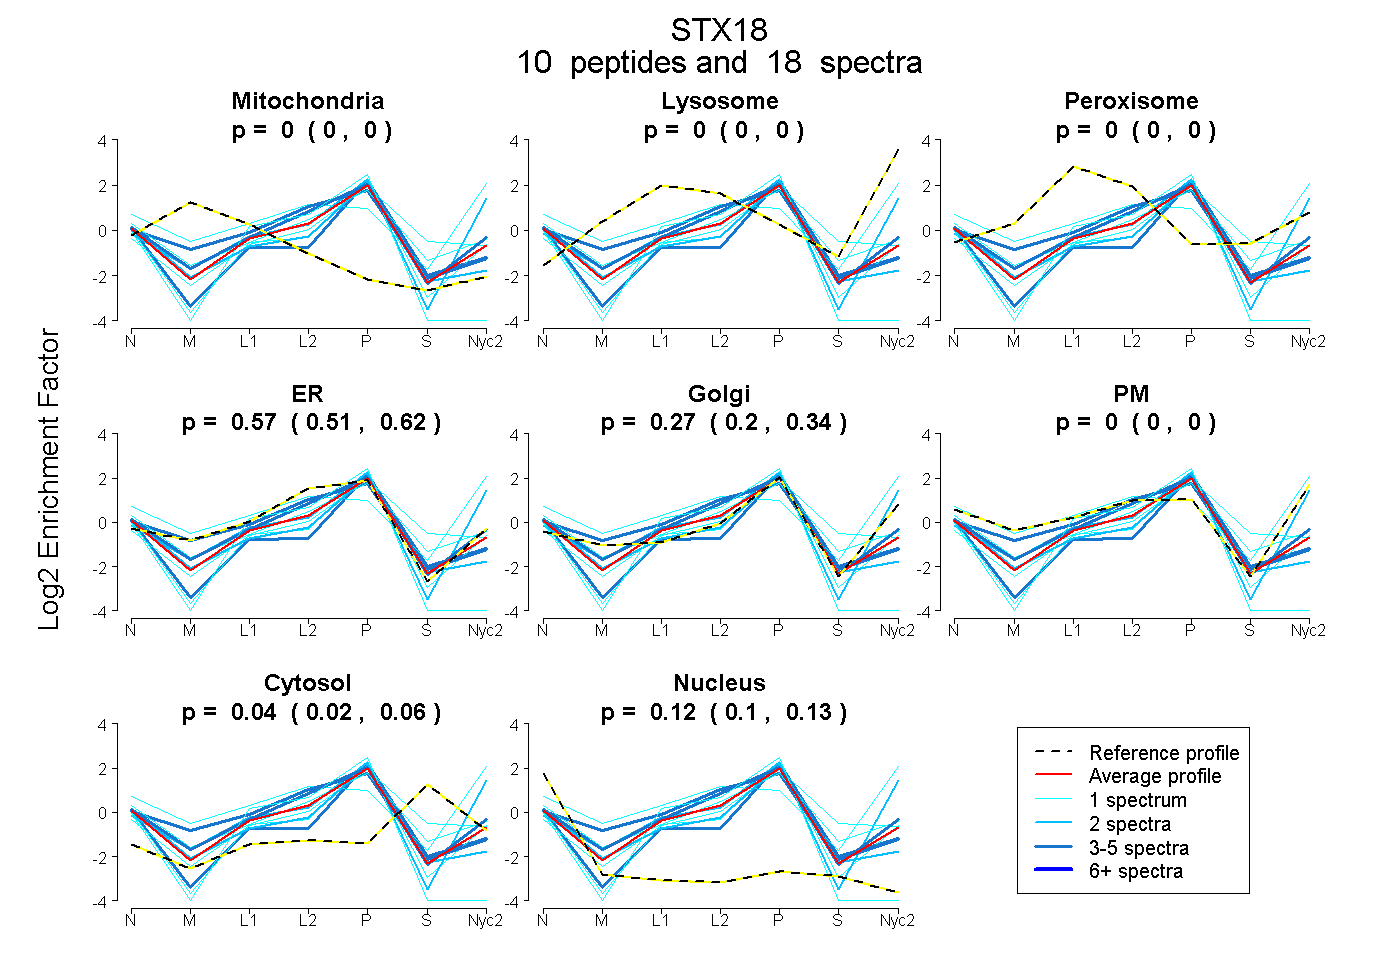
0.000 | 0.000
0.000 | 0.000
0.000 | 0.000
0.505 | 0.621
0.197 | 0.338
0.000 | 0.000
0.018 | 0.059
0.096 | 0.134
3peptides
spectra

0.000 | 0.000
0.000 | 0.000
0.657 | 0.768
0.207 | 0.333
0.000 | 0.000
0.000 | 0.000
0.000 | 0.011
5peptides
spectra
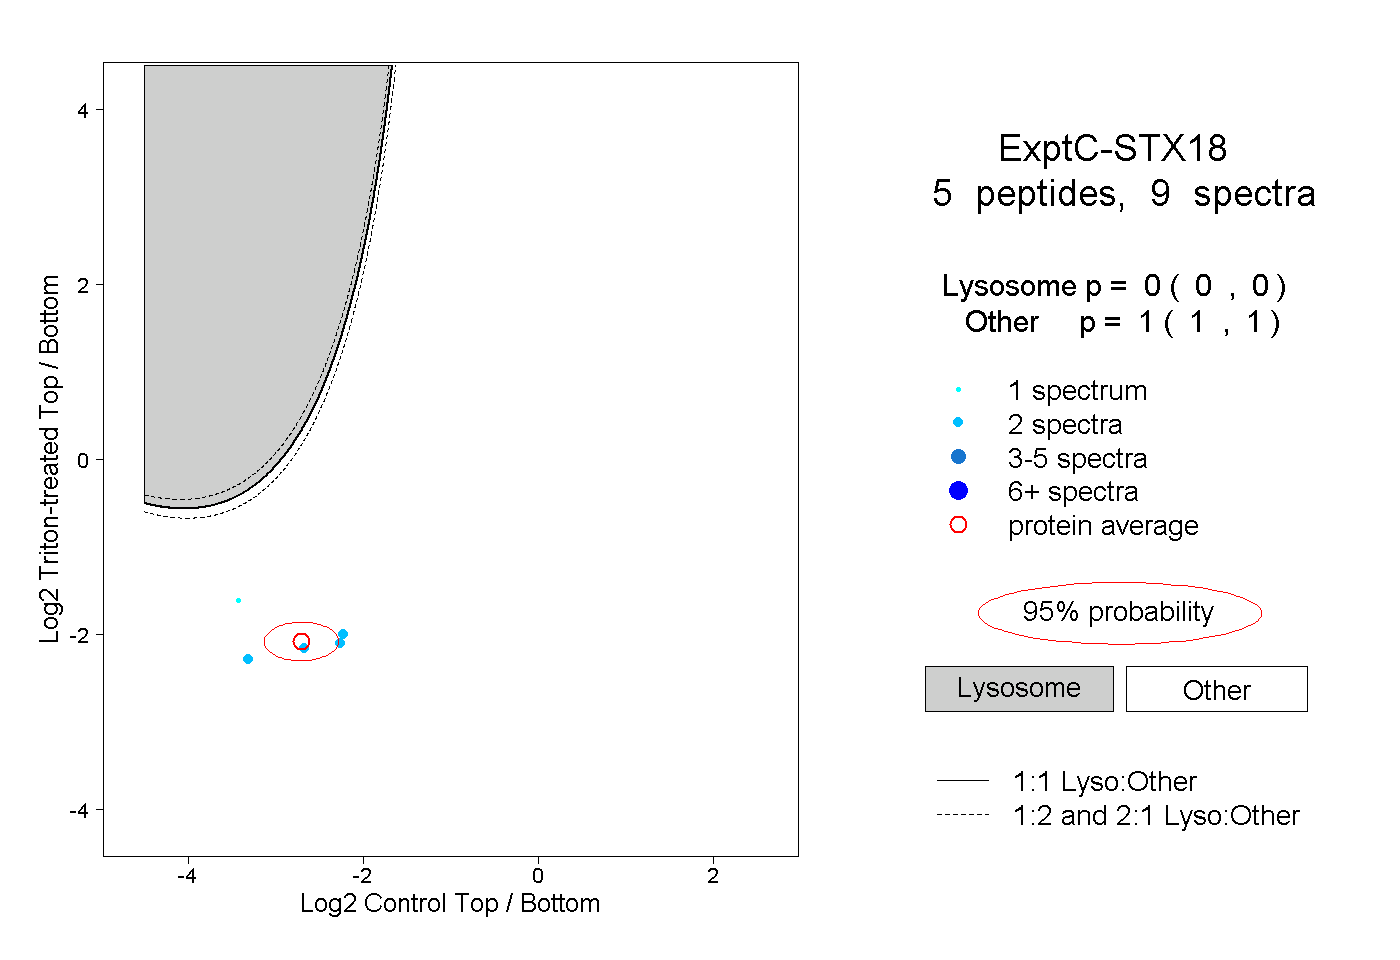
0.000 | 0.000
1.000 | 1.000
2peptides
spectra
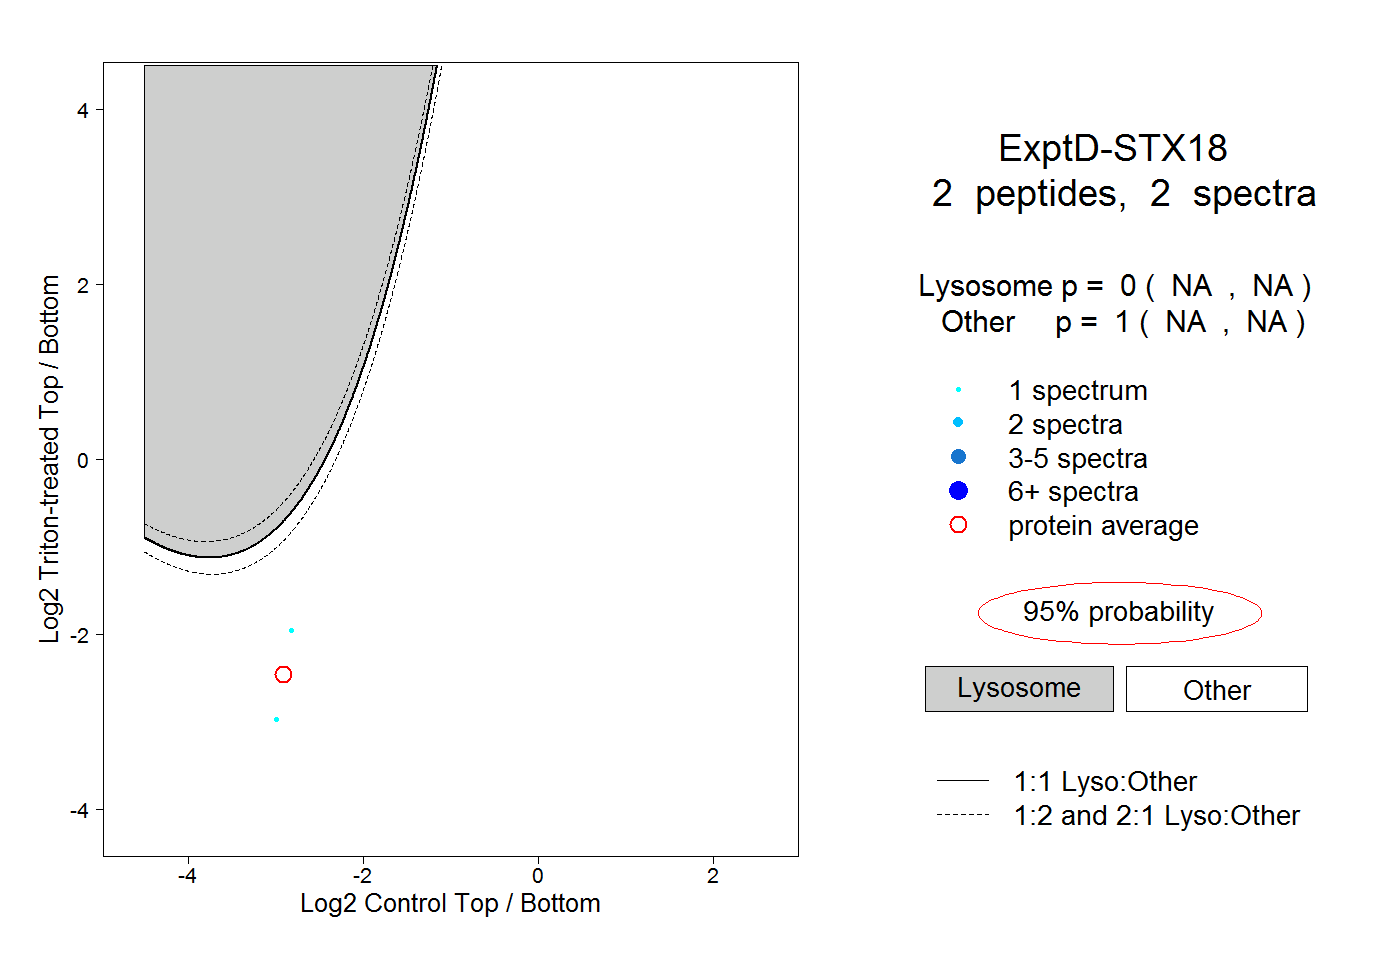
NA | NA
NA | NA