 10
10peptides
spectra
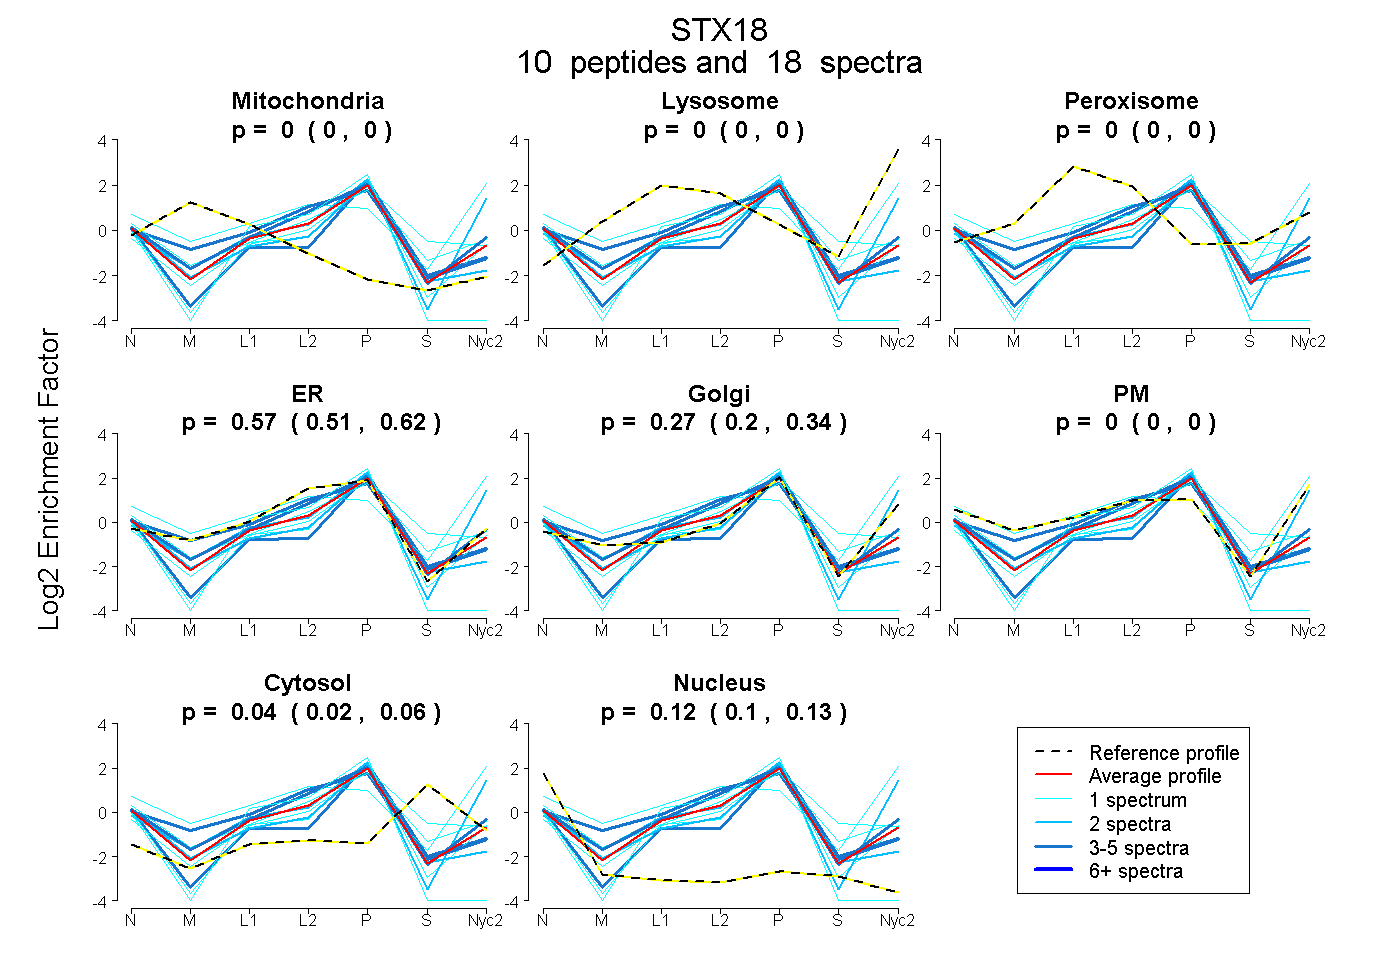
0.000 | 0.000
0.000 | 0.000
0.000 | 0.000
0.505 | 0.621
0.197 | 0.338
0.000 | 0.000
0.018 | 0.059
0.096 | 0.134
| Plot | Mito | Lyso | Perox | ER | Golgi | PM | Cytosol | Nucleus | |||||
| Expt A |
10 peptides |
18 spectra |
|
0.000 0.000 | 0.000 |
0.000 0.000 | 0.000 |
0.000 0.000 | 0.000 |
0.570 0.505 | 0.621 |
0.275 0.197 | 0.338 |
0.000 0.000 | 0.000 |
0.039 0.018 | 0.059 |
0.117 0.096 | 0.134 |
| 3 spectra, DFLLEHR | 0.008 | 0.000 | 0.000 | 0.877 | 0.000 | 0.000 | 0.032 | 0.082 | ||
| 1 spectrum, DQIDQDAQIFMR | 0.000 | 0.000 | 0.000 | 0.381 | 0.249 | 0.000 | 0.370 | 0.000 | ||
| 3 spectra, LQEIFTEK | 0.000 | 0.000 | 0.000 | 0.667 | 0.253 | 0.000 | 0.019 | 0.061 | ||
| 2 spectra, DAIQQLR | 0.000 | 0.000 | 0.000 | 0.007 | 0.772 | 0.221 | 0.000 | 0.000 | ||
| 1 spectrum, TAVLDFVEDYLK | 0.000 | 0.000 | 0.000 | 0.711 | 0.000 | 0.000 | 0.000 | 0.289 | ||
| 1 spectrum, DELFR | 0.000 | 0.108 | 0.000 | 0.000 | 0.000 | 0.860 | 0.032 | 0.000 | ||
| 3 spectra, ALGVAVGGGADGSR | 0.000 | 0.000 | 0.000 | 0.223 | 0.487 | 0.000 | 0.089 | 0.202 | ||
| 2 spectra, LEPEPHTK | 0.000 | 0.000 | 0.000 | 0.593 | 0.161 | 0.000 | 0.008 | 0.237 | ||
| 1 spectrum, EIHSQQVK | 0.000 | 0.000 | 0.000 | 0.550 | 0.228 | 0.000 | 0.192 | 0.030 | ||
| 1 spectrum, AVDITLLFR | 0.000 | 0.000 | 0.000 | 0.262 | 0.561 | 0.000 | 0.000 | 0.176 |
| Plot | Mito | Lyso or Perox | ER | Golgi | PM | Cytosol | Nucleus | ||||||
| Expt B |
3 peptides |
4 spectra |
 |
0.000 0.000 | 0.000 |
0.000 0.000 | 0.000 |
0.714 0.657 | 0.768 |
0.285 0.207 | 0.333 |
0.000 0.000 | 0.000 |
0.000 0.000 | 0.000 |
0.001 0.000 | 0.011 |
|||
| Plot | Lyso | Other | |||||||||||
| Expt C |
5 peptides |
9 spectra |
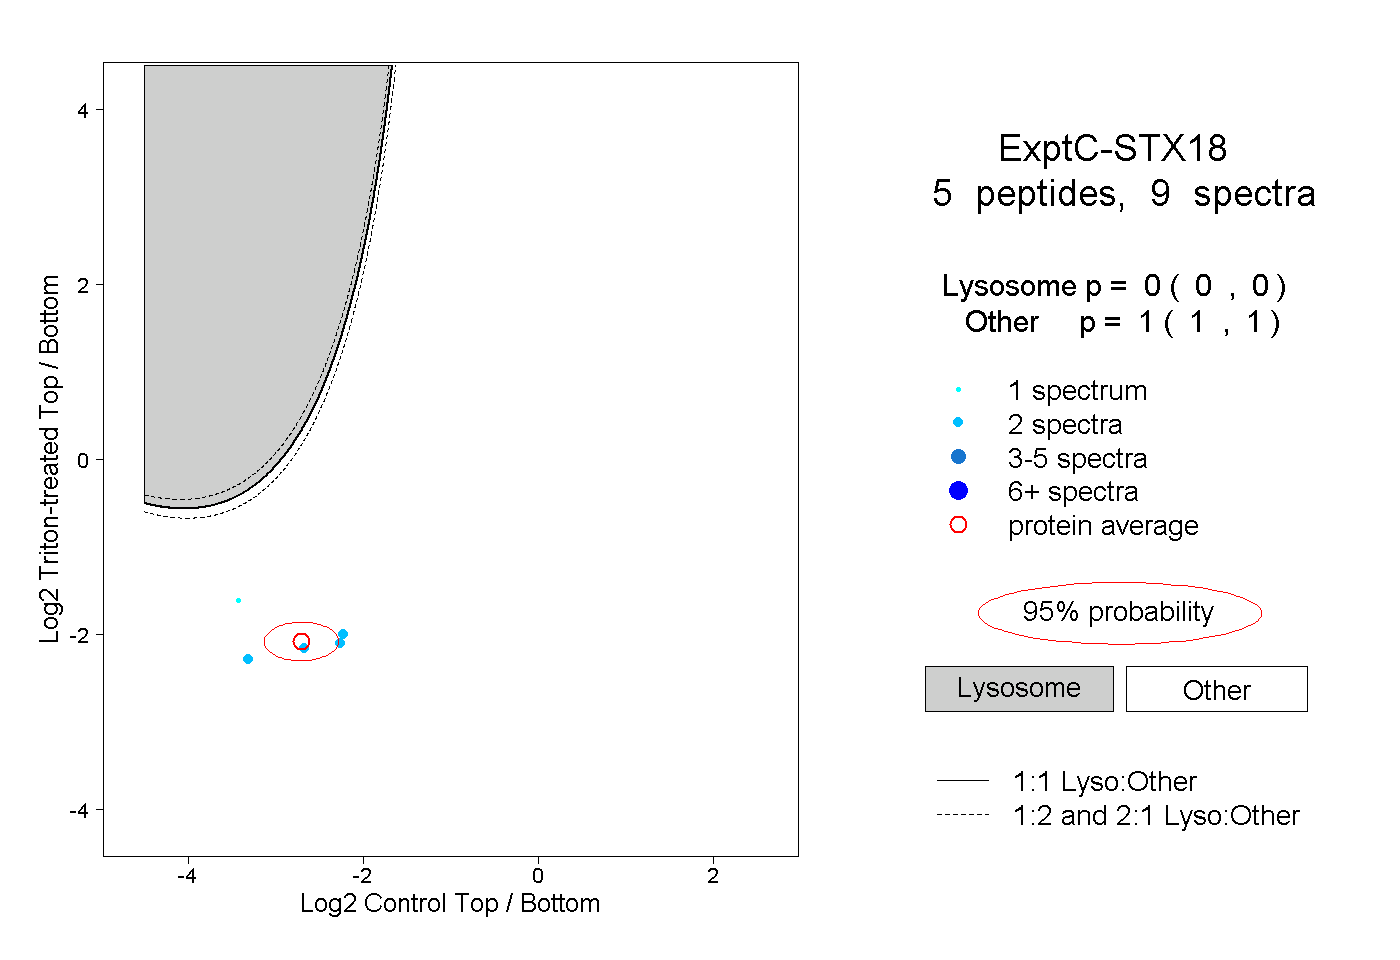 |
0.000 0.000 | 0.000 |
1.000 1.000 | 1.000 |
||||||||
| Plot | Lyso | Other | |||||||||||
| Expt D |
2 peptides |
2 spectra |
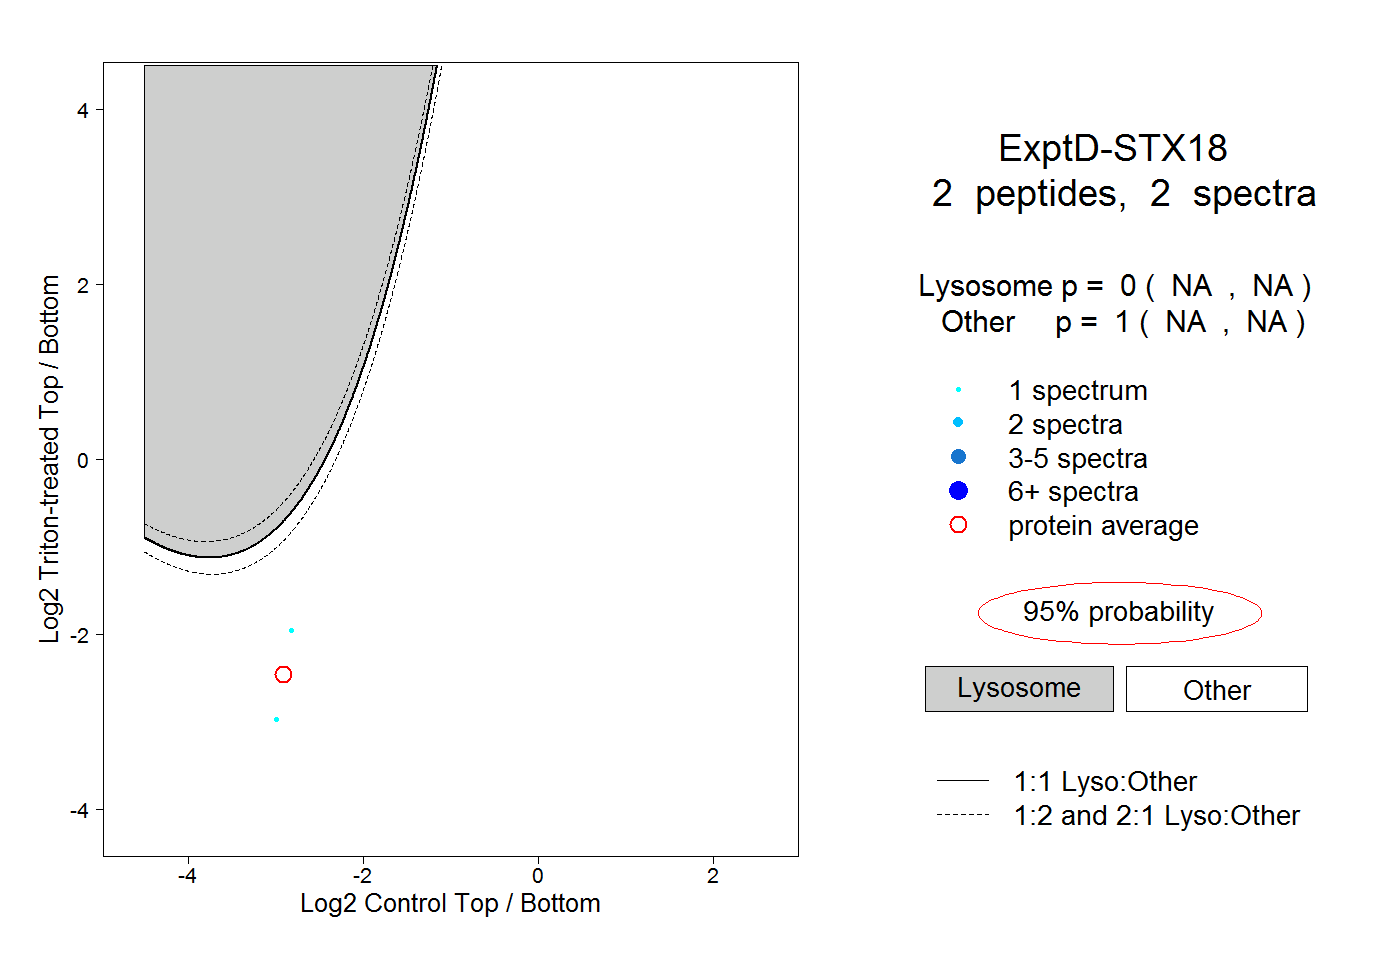 |
0.000 NA | NA |
1.000 NA | NA |