 11
11peptides
spectra
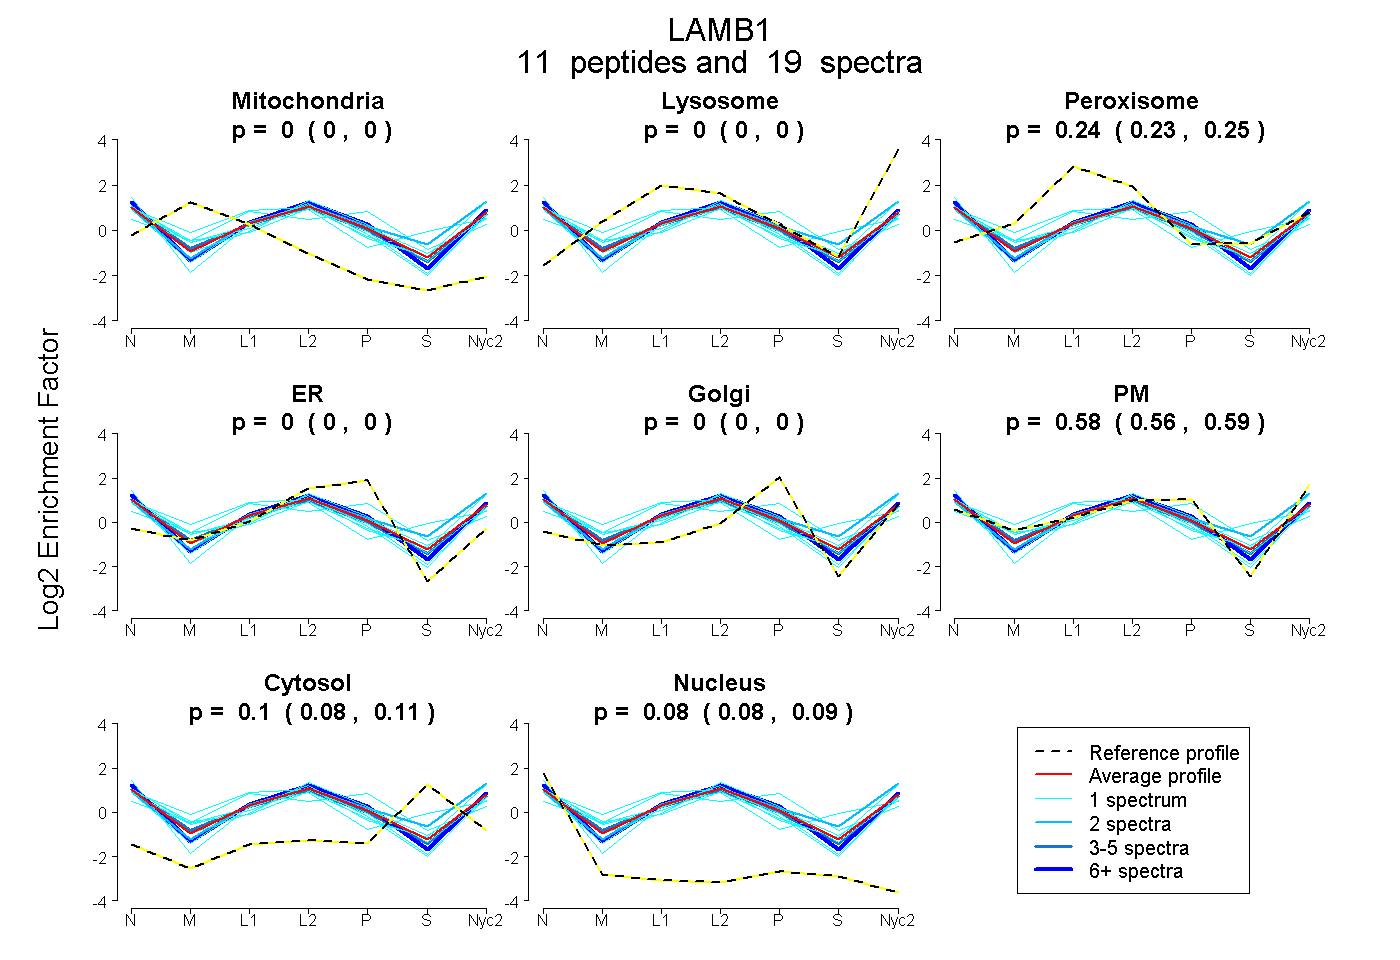
0.000 | 0.000
0.000 | 0.000
0.227 | 0.251
0.000 | 0.000
0.000 | 0.000
0.564 | 0.588
0.084 | 0.110
0.076 | 0.091
1peptide
spectrum
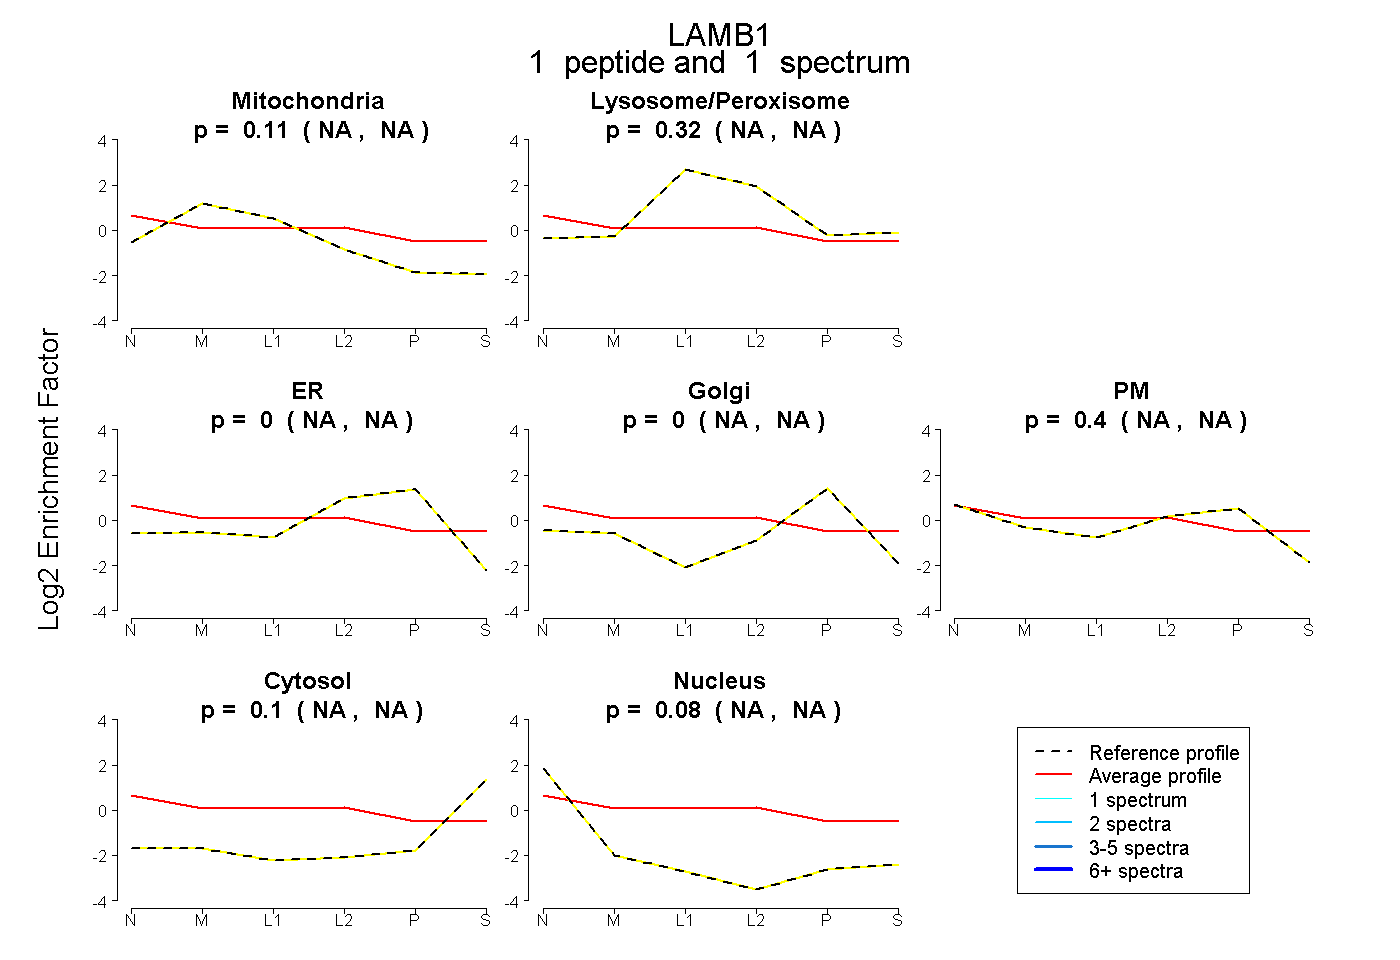
NA | NA
NA | NA
NA | NA
NA | NA
NA | NA
NA | NA
NA | NA
11peptides
spectra
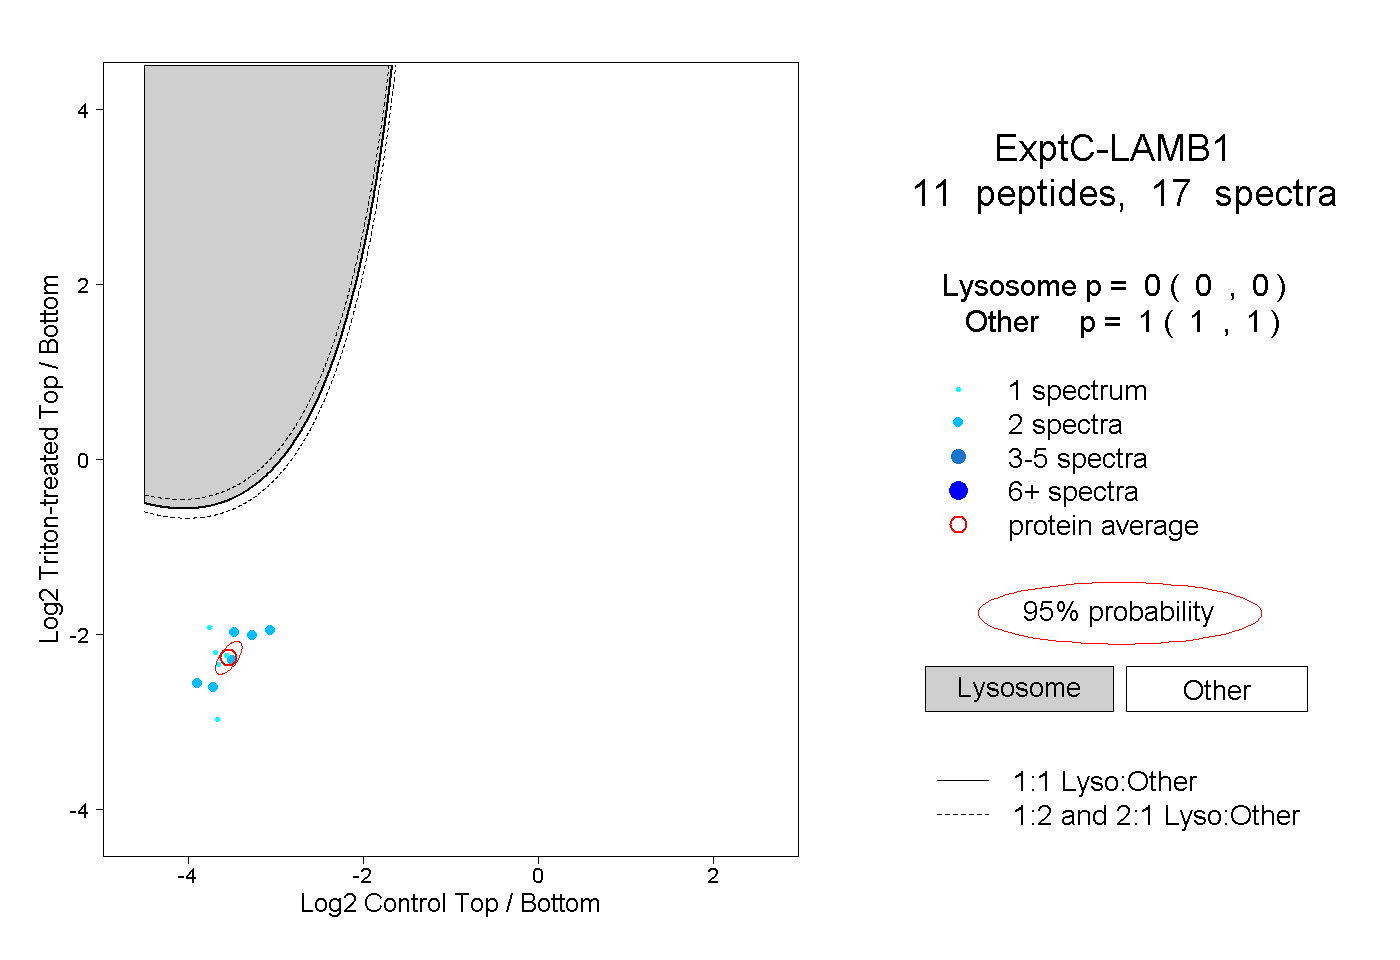
0.000 | 0.000
1.000 | 1.000
1peptide
spectra
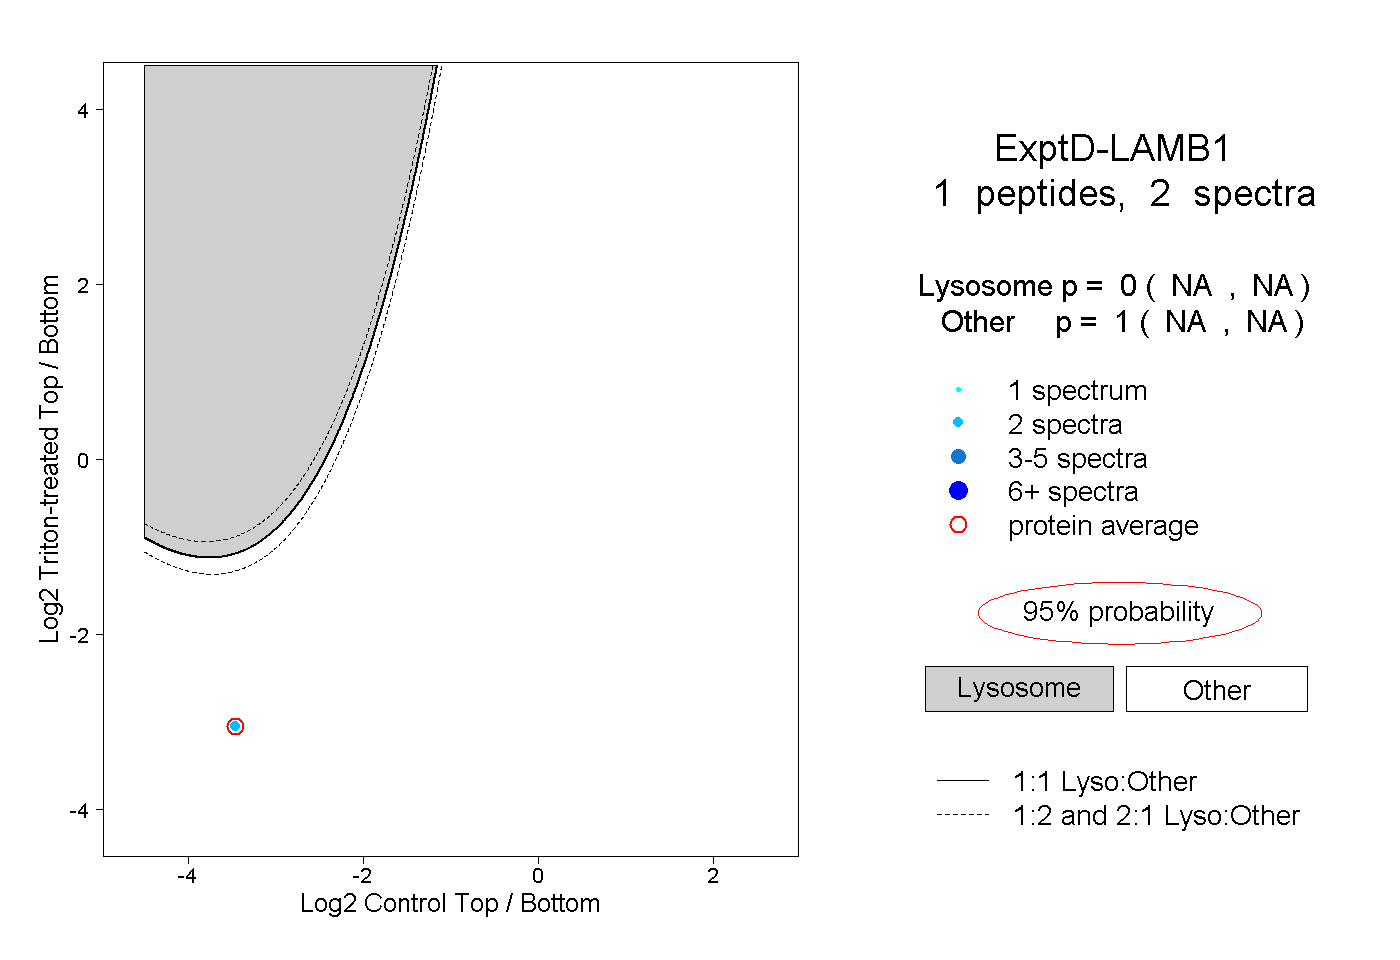
NA | NA
NA | NA