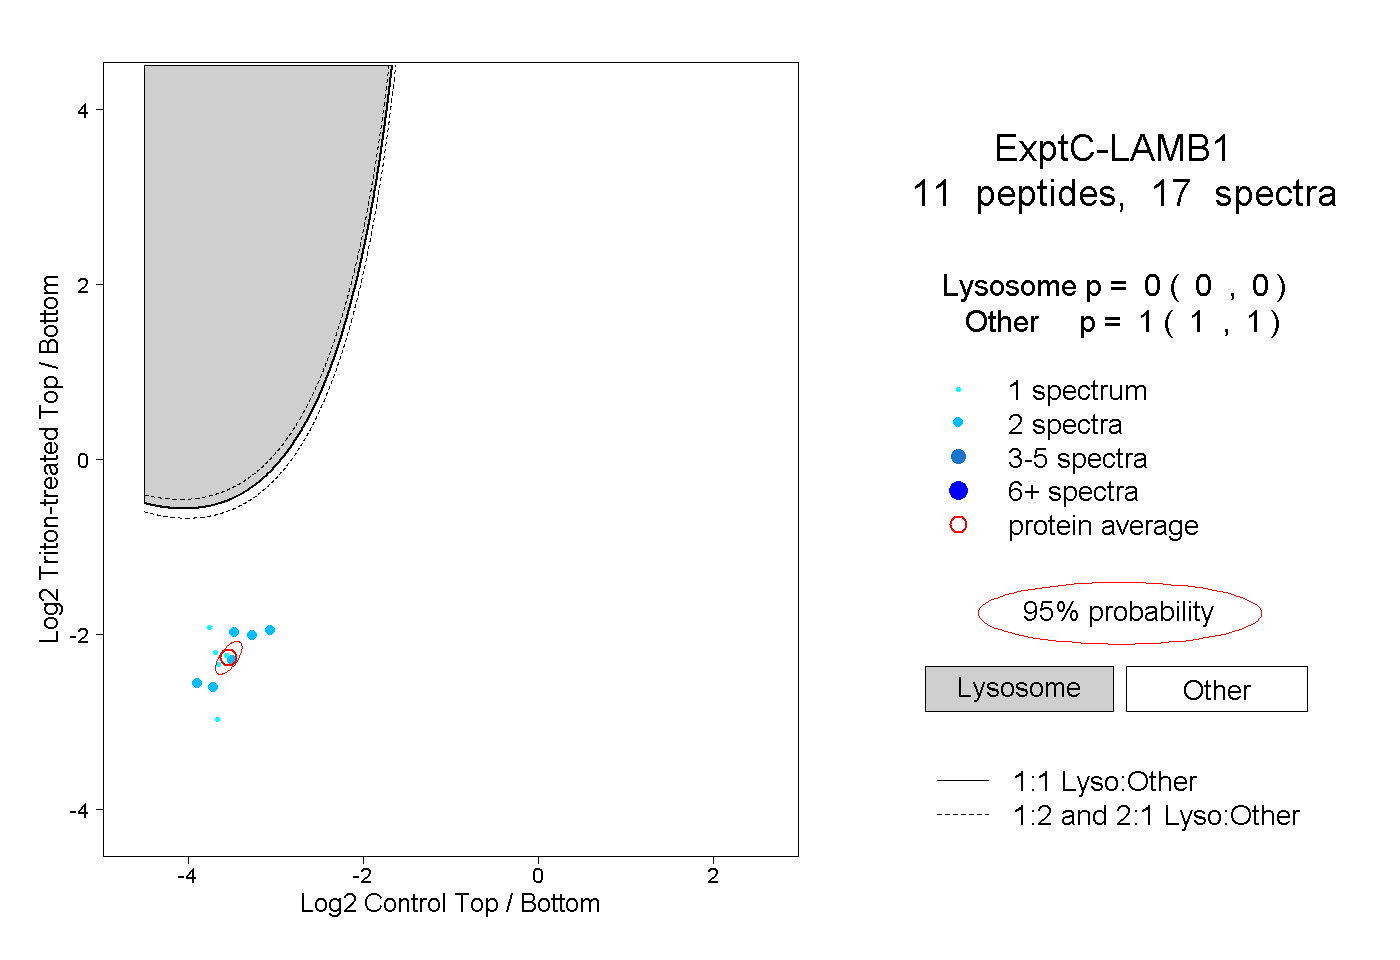
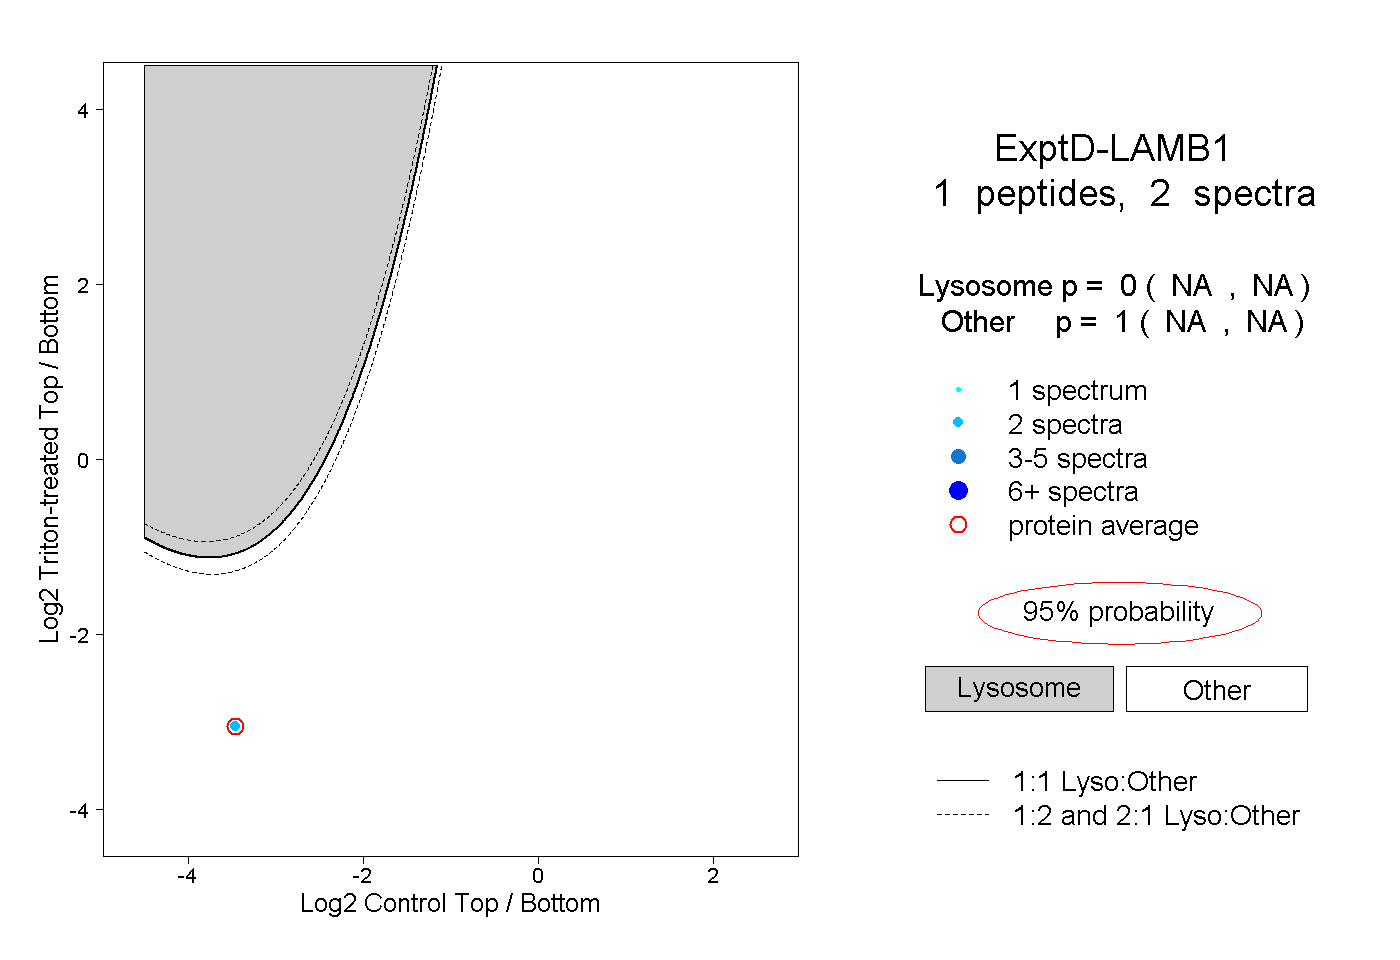
LAMB1
[ENSRNOP00000008321]
Main page
| | | Plot |
Mito |
Lyso |
|
Perox |
ER |
Golgi |
PM |
Cytosol |
Nucleus |
|
| Expt A |
 11
11
peptides |
19
spectra |
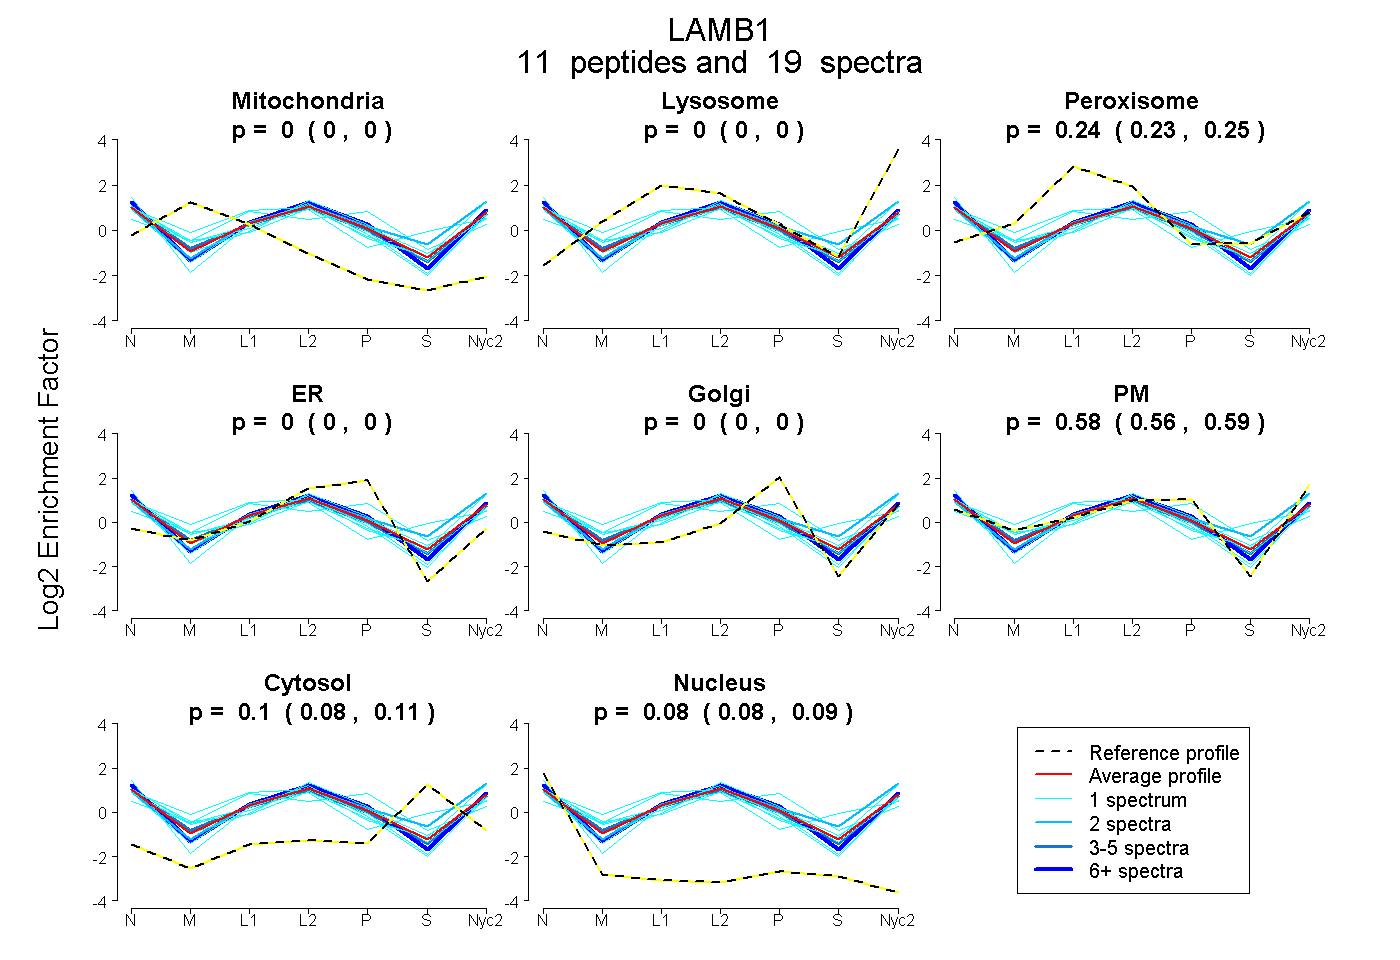 |
0.000
0.000 | 0.000 |
0.000
0.000 | 0.000 |
|
0.240
0.227 | 0.251 |
0.000
0.000 | 0.000 |
0.000
0.000 | 0.000 |
0.577
0.564 | 0.588 |
0.098
0.084 | 0.110 |
0.084
0.076 | 0.091 |
|
| | | Plot |
Mito |
|
Lyso or Perox |
|
ER |
Golgi |
PM |
Cytosol |
Nucleus |
|
| Expt B |
1
peptide |
1
spectrum |
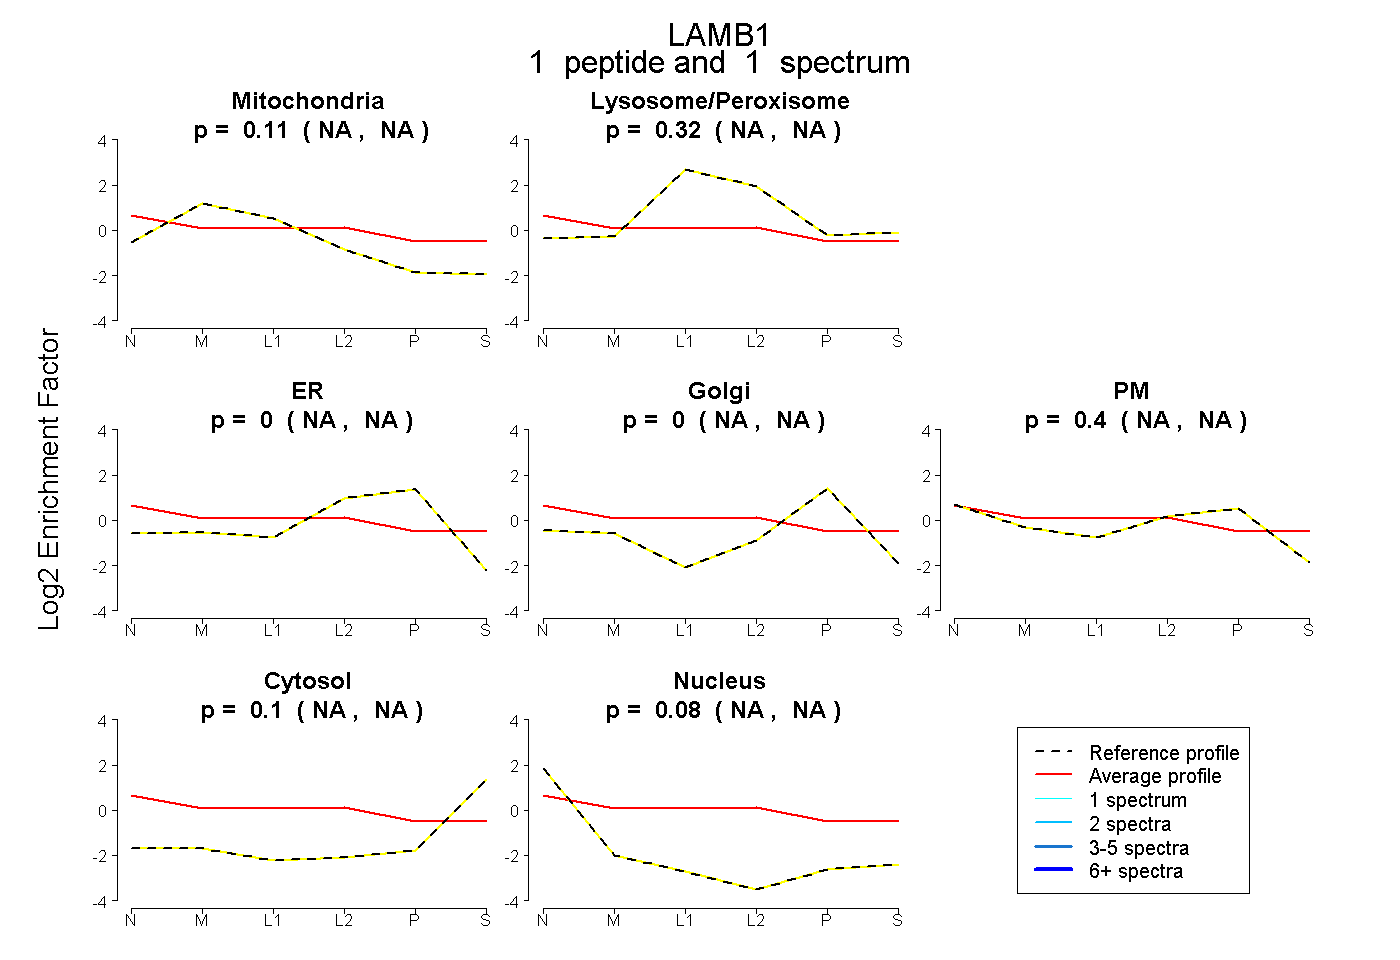 |
0.111
NA | NA |
|
0.320
NA | NA |
|
0.000
NA | NA |
0.000
NA | NA |
0.397
NA | NA |
0.097
NA | NA |
0.076
NA | NA |
|
| | | Plot |
|
Lyso |
|
|
|
|
|
|
|
Other |
| Expt C |
11
peptides |
17
spectra |
 |
|
0.000
0.000 | 0.000 |
|
|
|
|
|
|
|
1.000
1.000 | 1.000 |
| 1 spectrum, VVYSVK |
|
0.000 |
|
|
|
|
|
|
|
1.000 |
| 2 spectra, LQLLEDLER |
|
0.000 |
|
|
|
|
|
|
|
1.000 |
| 1 spectrum, LHVEGER |
|
0.000 |
|
|
|
|
|
|
|
1.000 |
| 1 spectrum, MVSEAK |
|
0.000 |
|
|
|
|
|
|
|
1.000 |
| 1 spectrum, SATDVK |
|
0.000 |
|
|
|
|
|
|
|
1.000 |
| 2 spectra, LLDELAGK |
|
0.000 |
|
|
|
|
|
|
|
1.000 |
| 1 spectrum, ISGVIGPYR |
|
0.000 |
|
|
|
|
|
|
|
1.000 |
| 2 spectra, SSDFGK |
|
0.000 |
|
|
|
|
|
|
|
1.000 |
| 2 spectra, IEDPYSPR |
|
0.000 |
|
|
|
|
|
|
|
1.000 |
| 2 spectra, AVITVQRPGR |
|
0.000 |
|
|
|
|
|
|
|
1.000 |
| 2 spectra, VDDIICDSR |
|
0.000 |
|
|
|
|
|
|
|
1.000 |
| | | Plot |
|
Lyso |
|
|
|
|
|
|
|
Other |
| Expt D |
1
peptide |
2
spectra |
 |
|
0.000
NA | NA |
|
|
|
|
|
|
|
1.000
NA | NA |