 100
100peptides
spectra
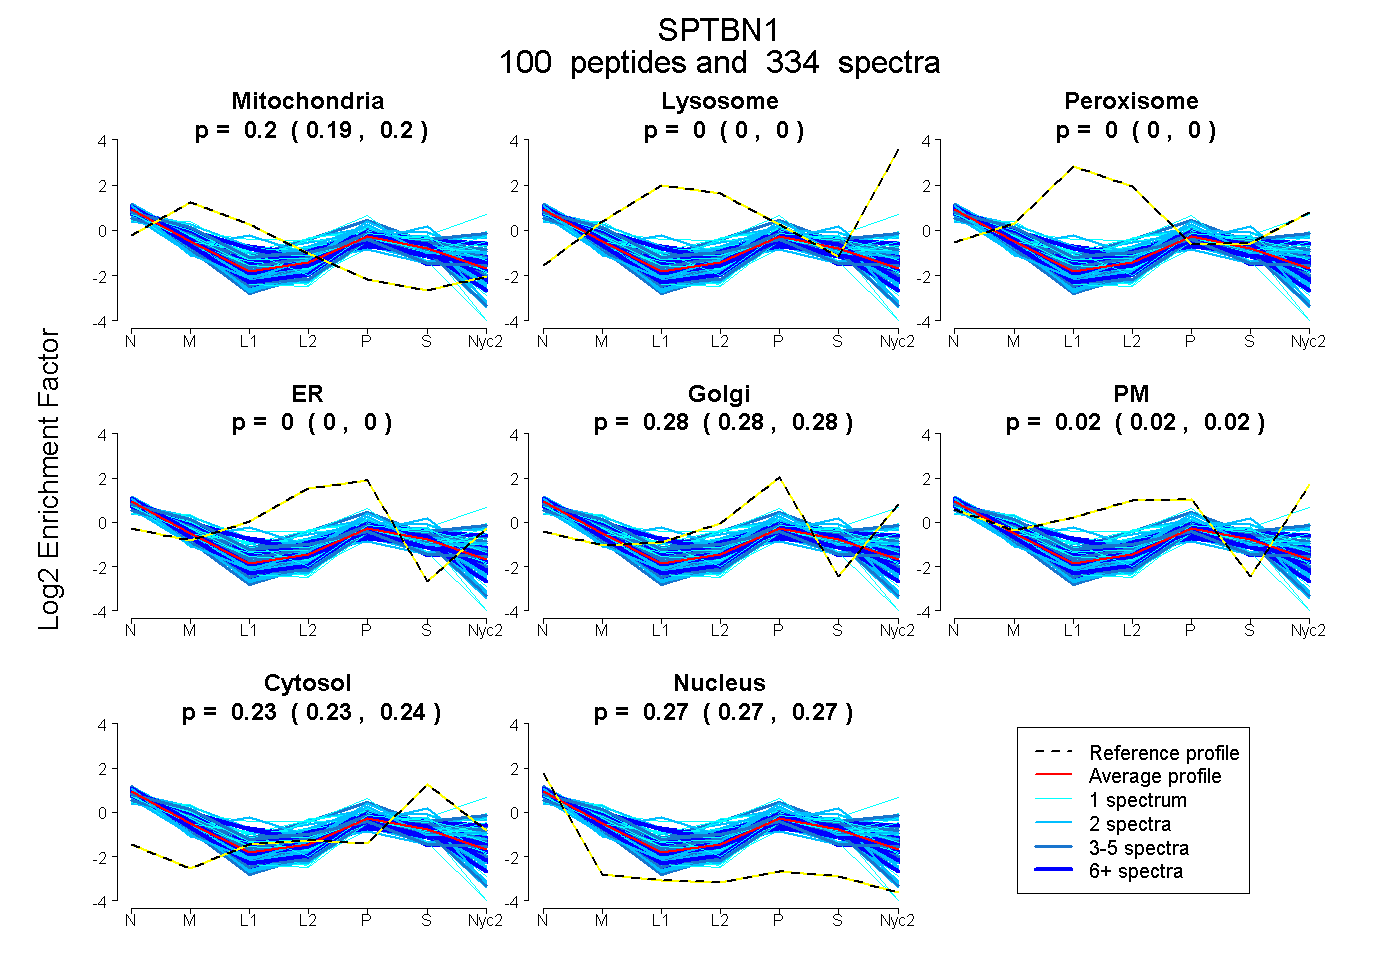
0.195 | 0.197
0.000 | 0.000
0.000 | 0.000
0.000 | 0.000
0.277 | 0.280
0.016 | 0.020
0.234 | 0.235
0.272 | 0.273
42peptides
spectra
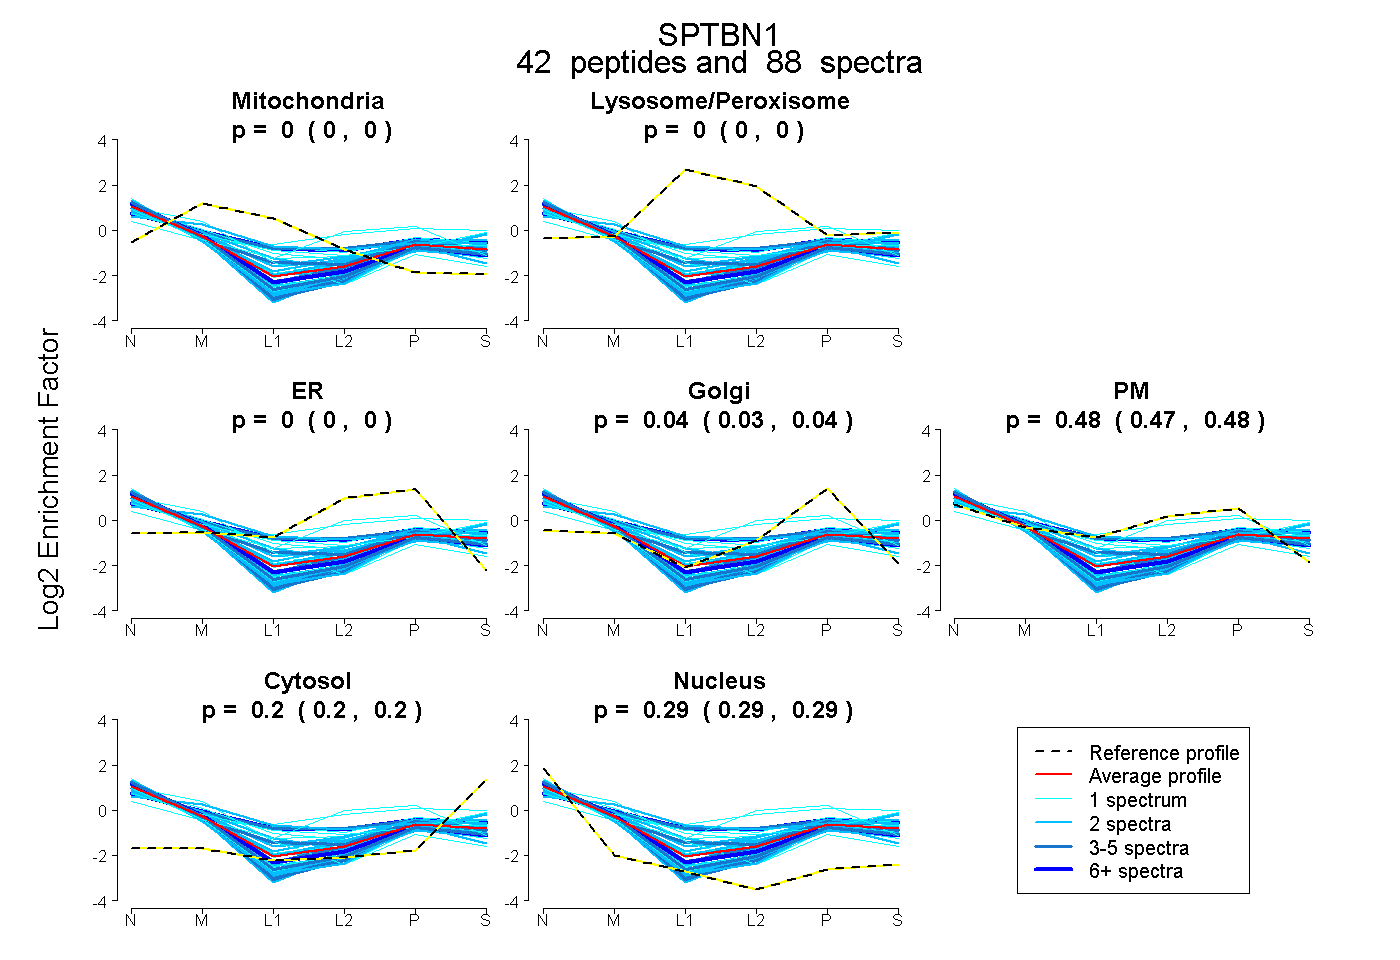
0.000 | 0.000
0.000 | 0.000
0.000 | 0.000
0.028 | 0.042
0.468 | 0.483
0.197 | 0.201
0.286 | 0.291
62peptides
spectra
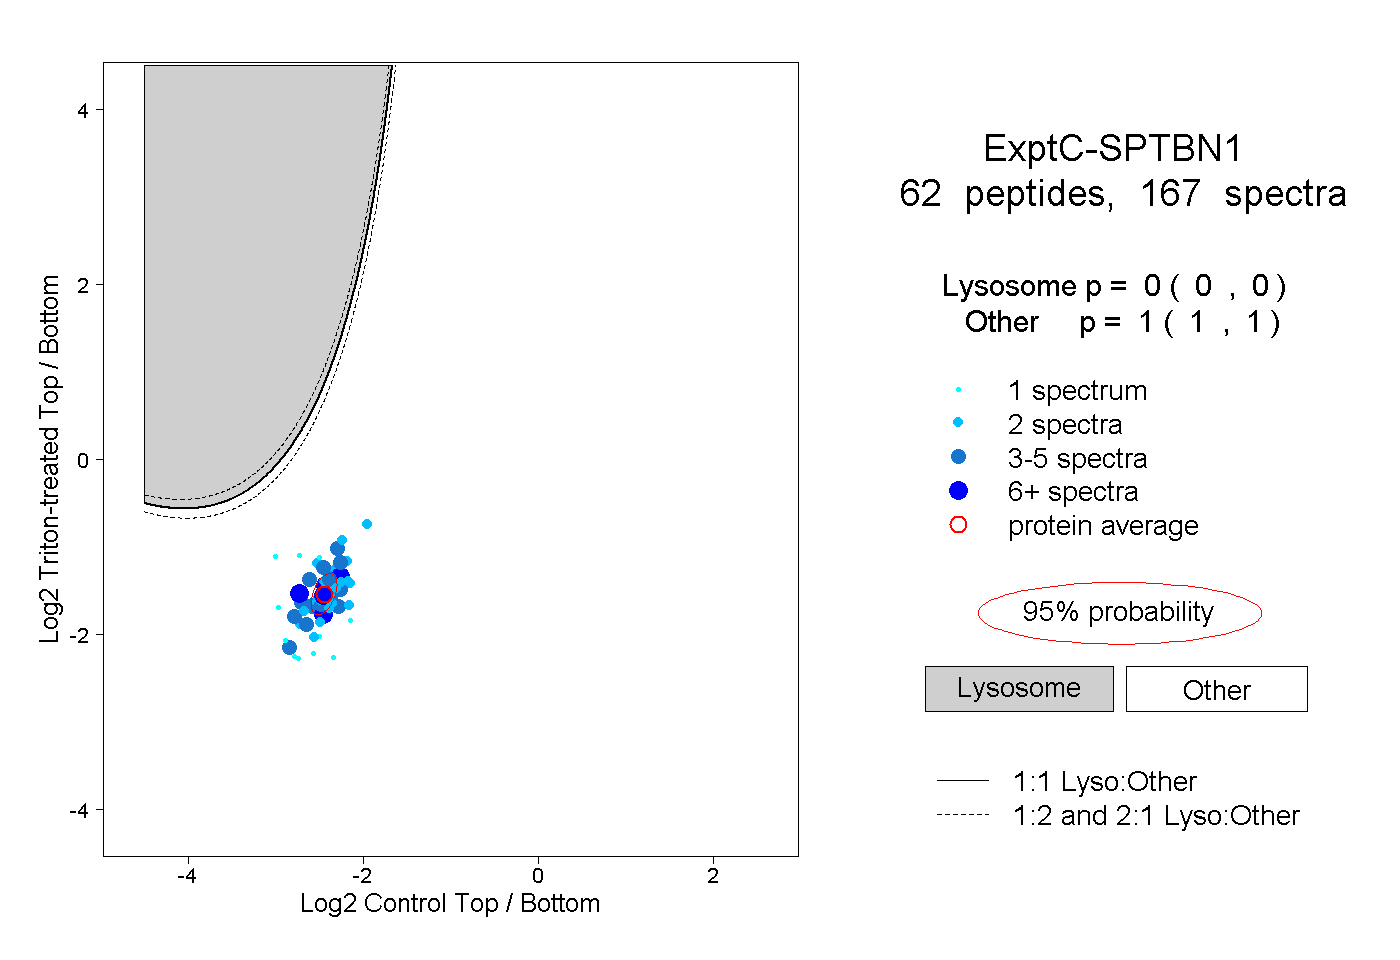
0.000 | 0.000
1.000 | 1.000
24peptides
spectra
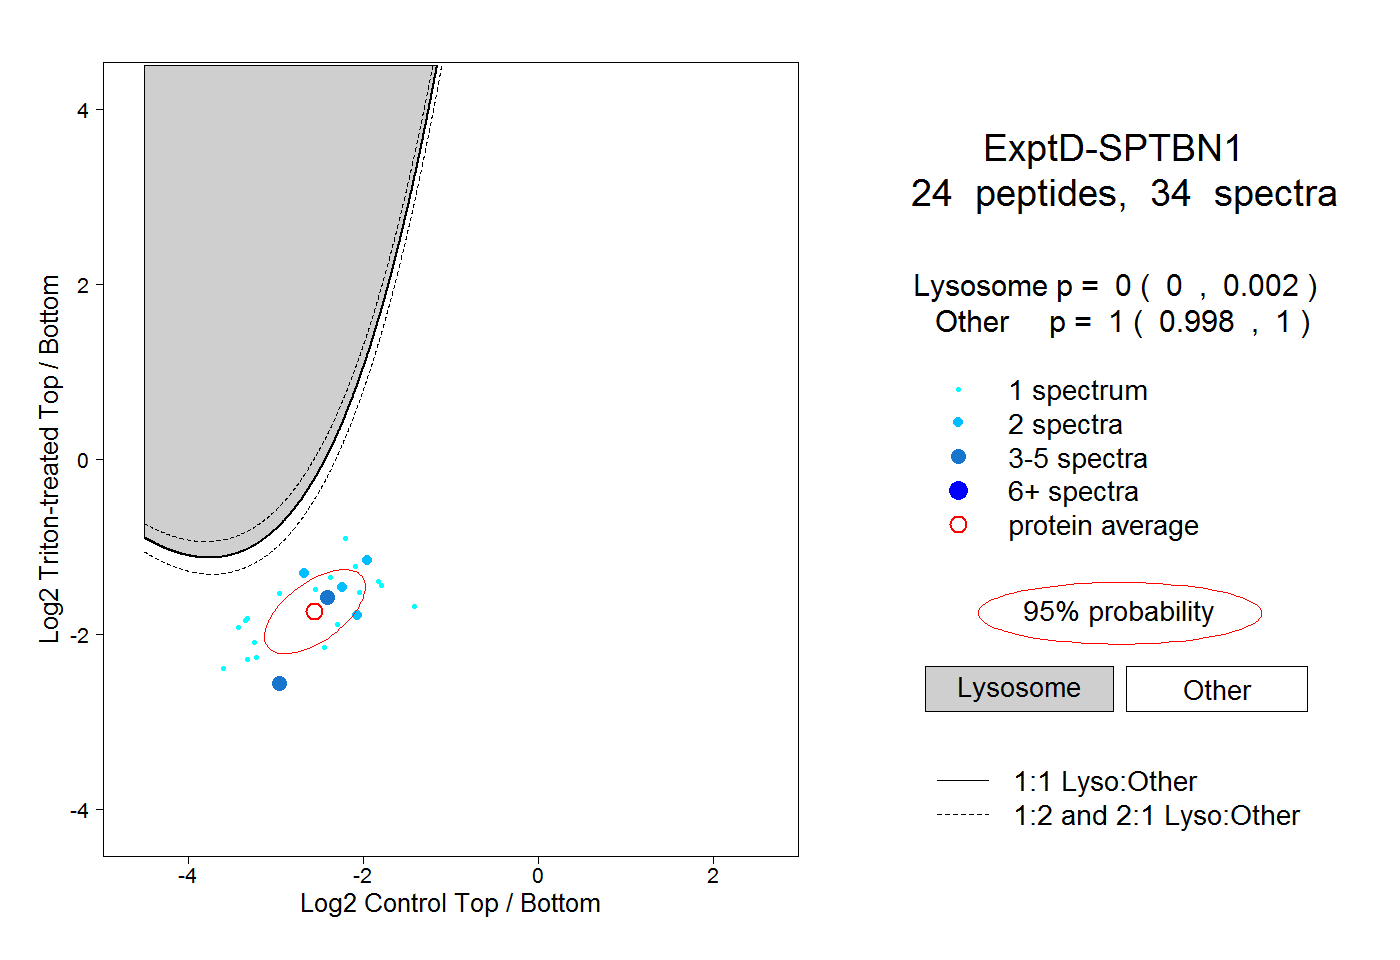
0.000 | 0.002
0.998 | 1.000