 4
4peptides
spectra
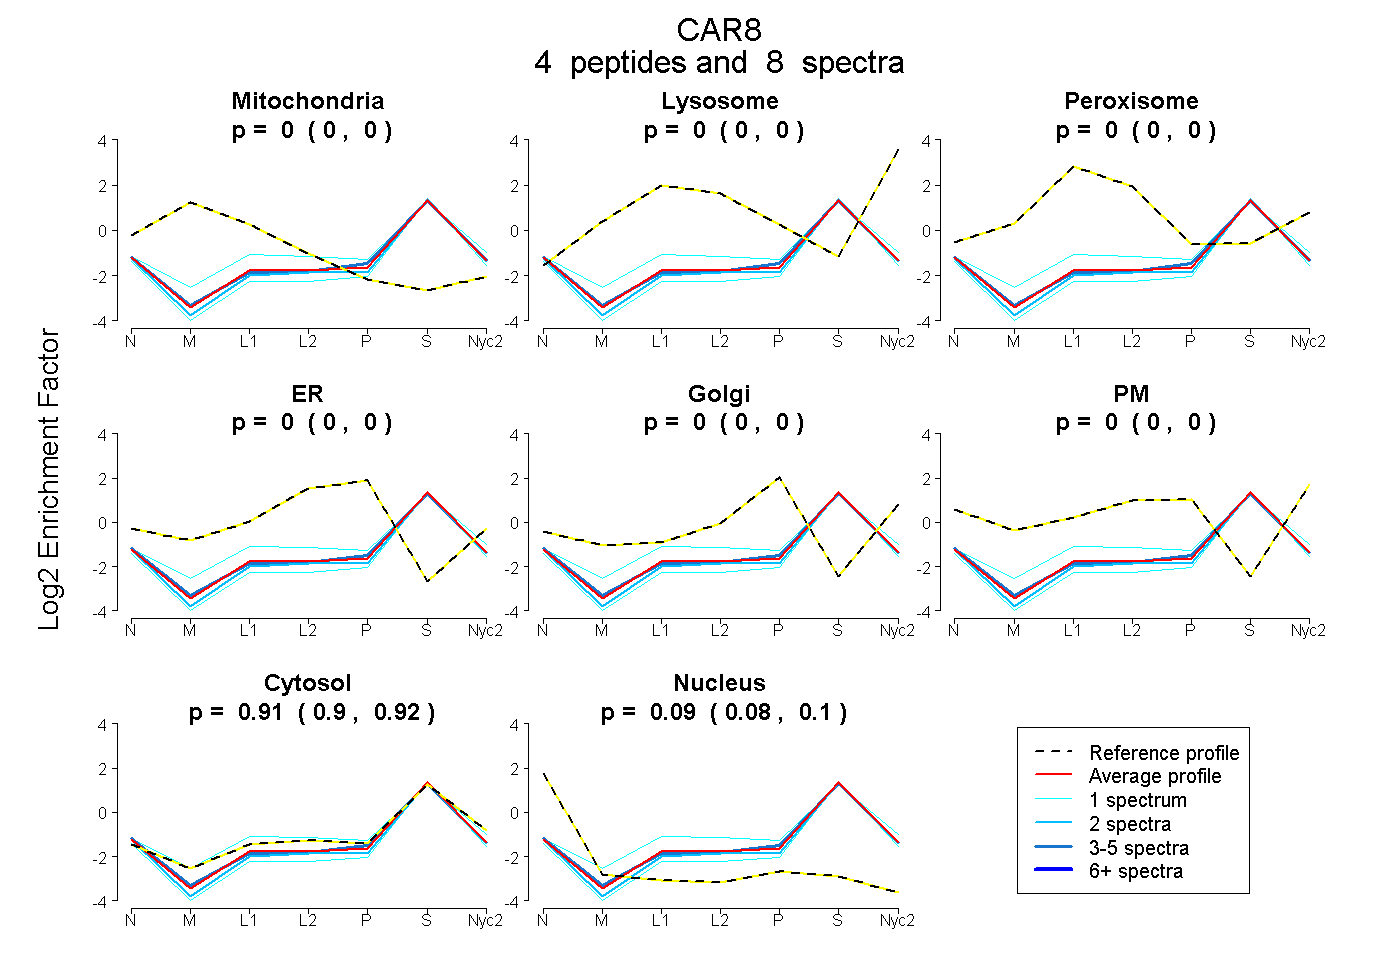
0.000 | 0.000
0.000 | 0.000
0.000 | 0.000
0.000 | 0.000
0.000 | 0.000
0.000 | 0.000
0.901 | 0.922
0.076 | 0.098
2peptides
spectra
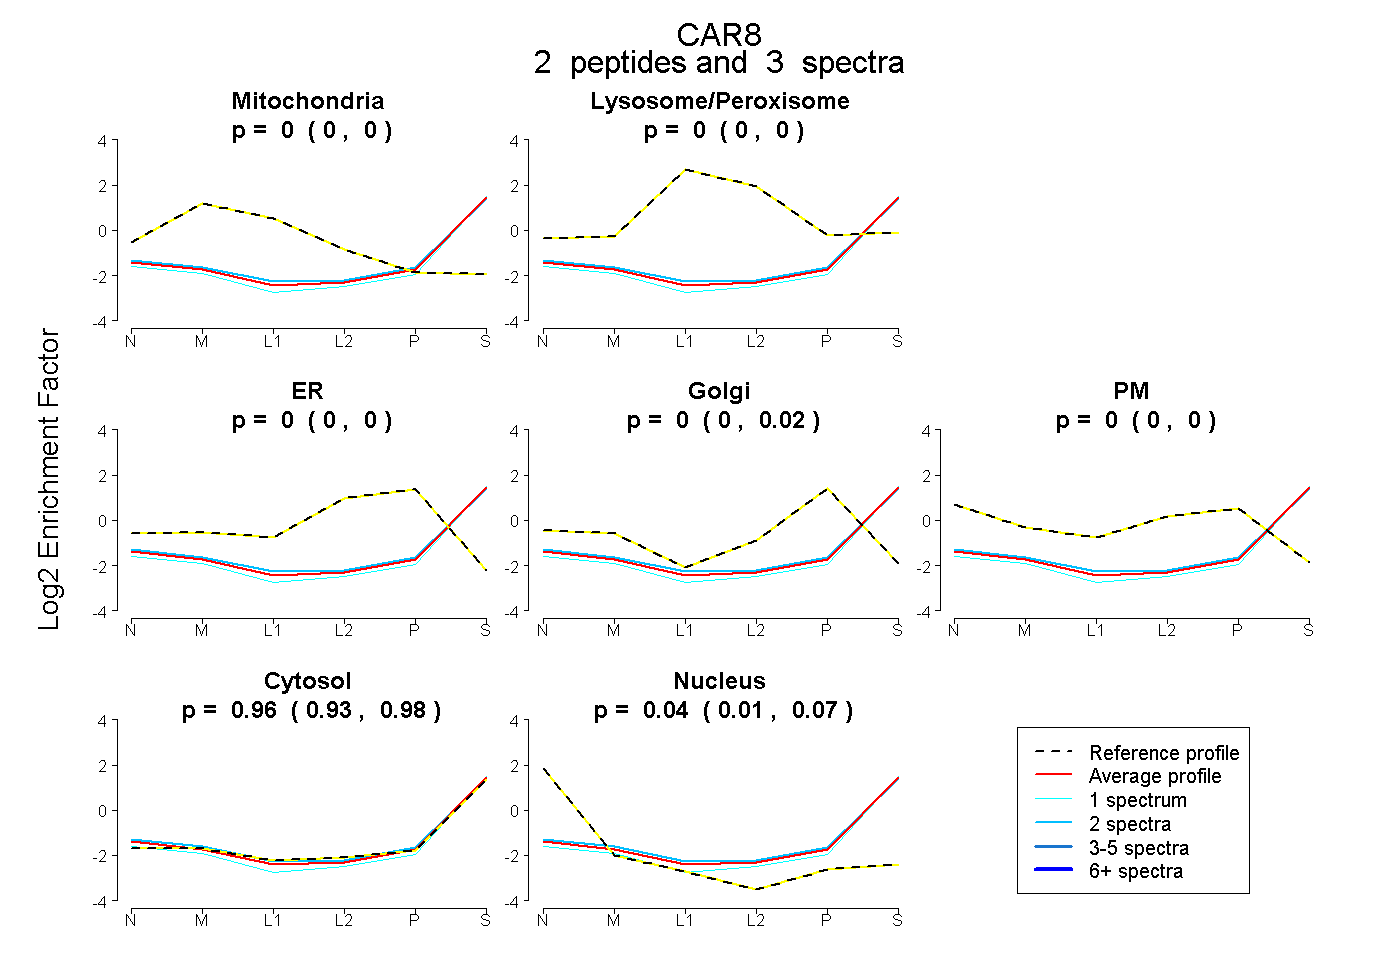
0.000 | 0.000
0.000 | 0.004
0.000 | 0.000
0.000 | 0.018
0.000 | 0.000
0.929 | 0.975
0.008 | 0.066
1peptide
spectra
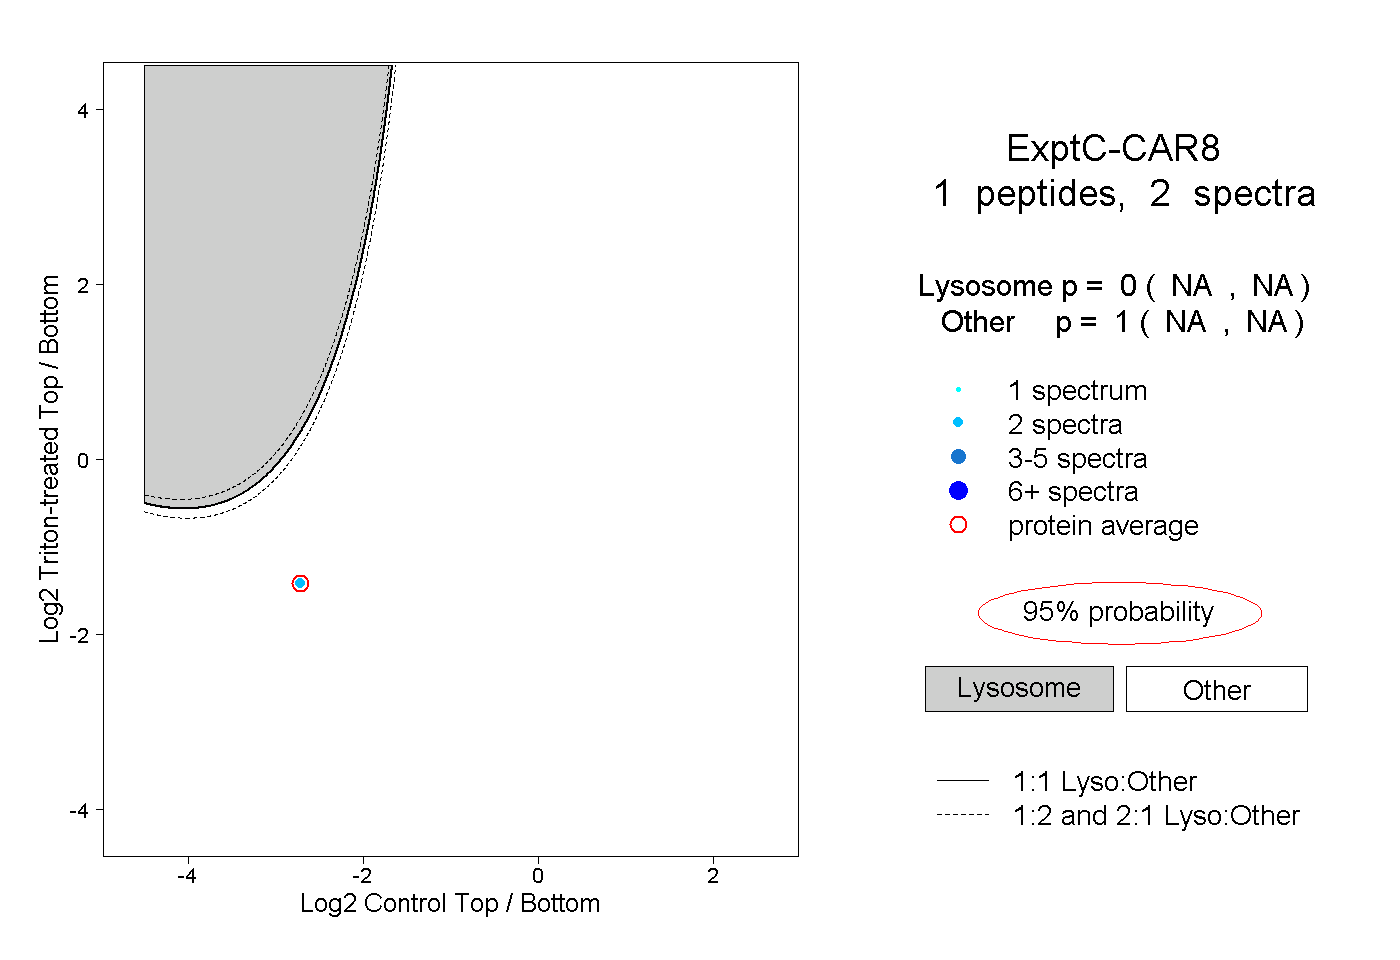
NA | NA
NA | NA