CAR8
[ENSRNOP00000007802]
Main page
| | | Plot |
Mito |
Lyso |
|
Perox |
ER |
Golgi |
PM |
Cytosol |
Nucleus |
|
| Expt A |
 4
4
peptides |
8
spectra |
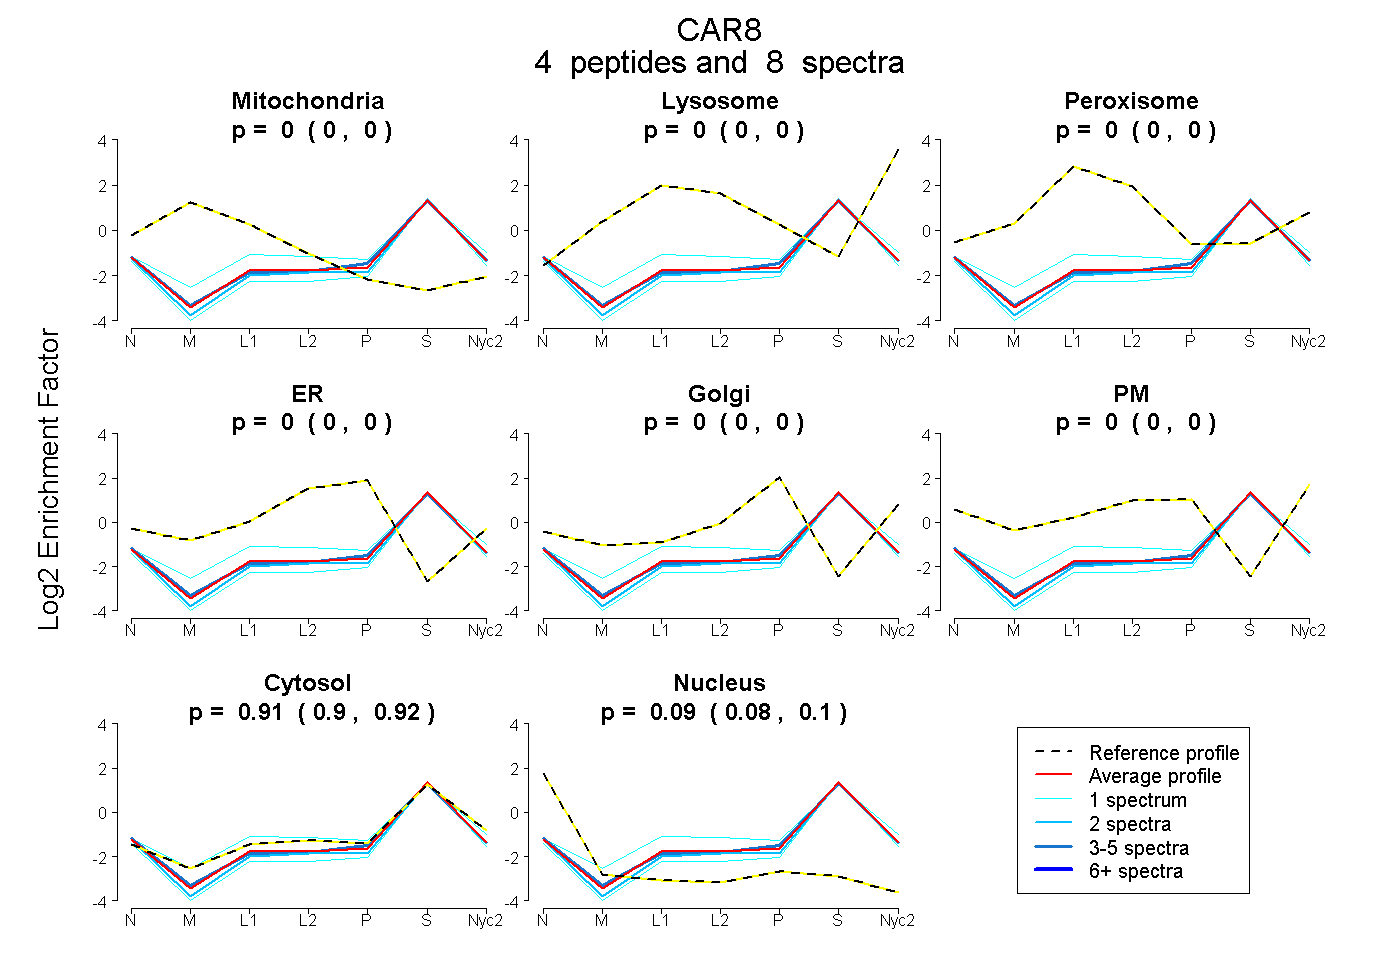 |
0.000
0.000 | 0.000 |
0.000
0.000 | 0.000 |
|
0.000
0.000 | 0.000 |
0.000
0.000 | 0.000 |
0.000
0.000 | 0.000 |
0.000
0.000 | 0.000 |
0.911
0.901 | 0.922 |
0.089
0.076 | 0.098 |
|
| | | Plot |
Mito |
|
Lyso or Perox |
|
ER |
Golgi |
PM |
Cytosol |
Nucleus |
|
| Expt B |
2
peptides |
3
spectra |
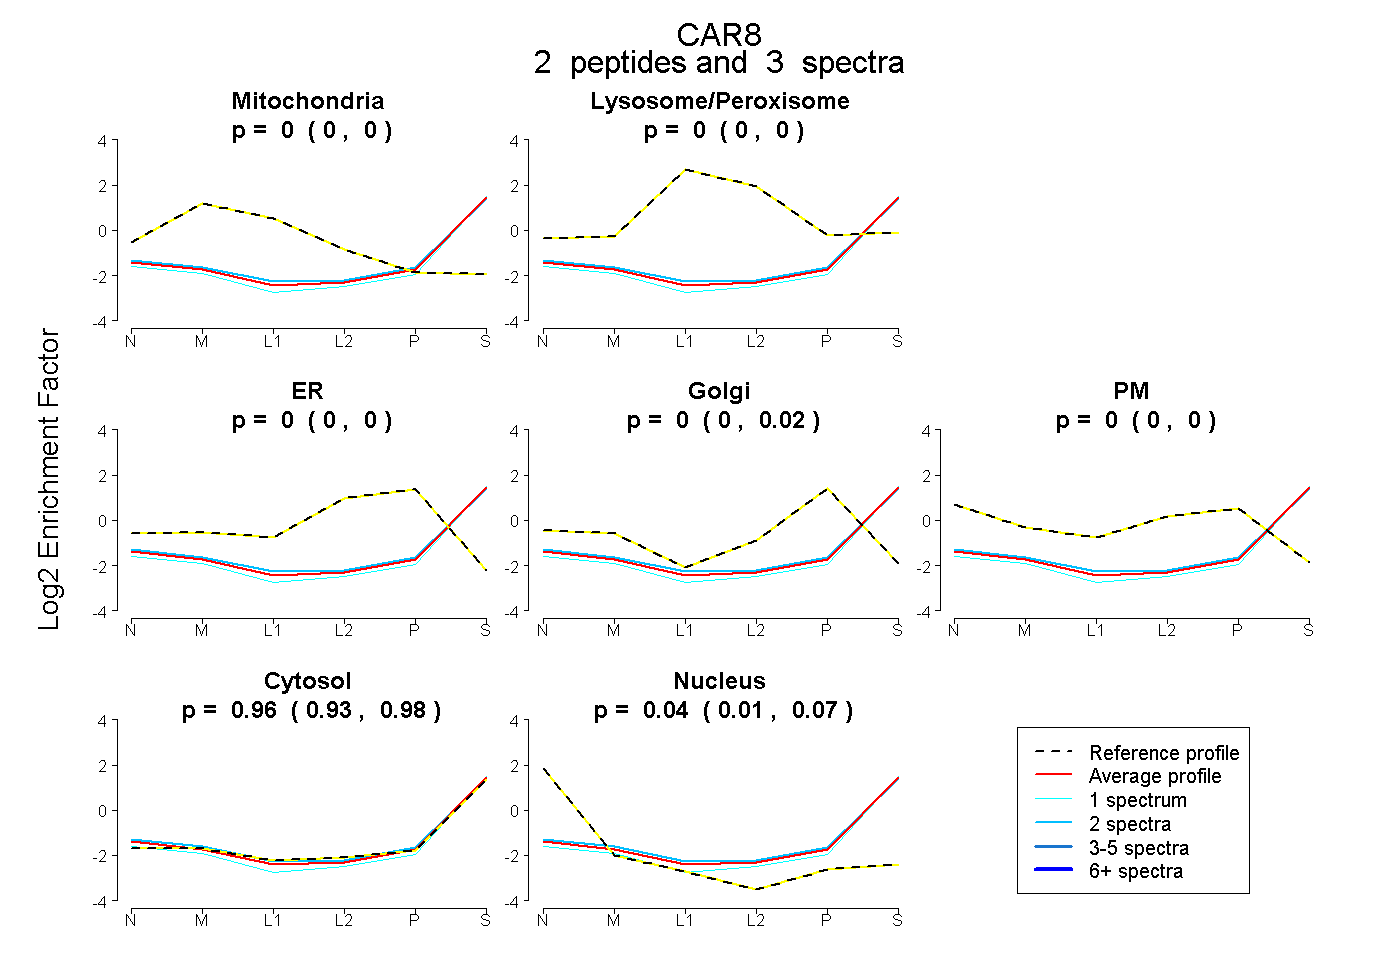 |
0.000
0.000 | 0.000 |
|
0.000
0.000 | 0.004 |
|
0.000
0.000 | 0.000 |
0.000
0.000 | 0.018 |
0.000
0.000 | 0.000 |
0.958
0.929 | 0.975 |
0.042
0.008 | 0.066 |
|
| 1 spectrum, YDPSLLDVR |
0.000 |
|
0.000 |
|
0.000 |
0.000 |
0.000 |
0.967 |
0.033 |
|
| 2 spectra, LSPNYVVCR |
0.000 |
|
0.000 |
|
0.000 |
0.000 |
0.006 |
0.950 |
0.044 |
|
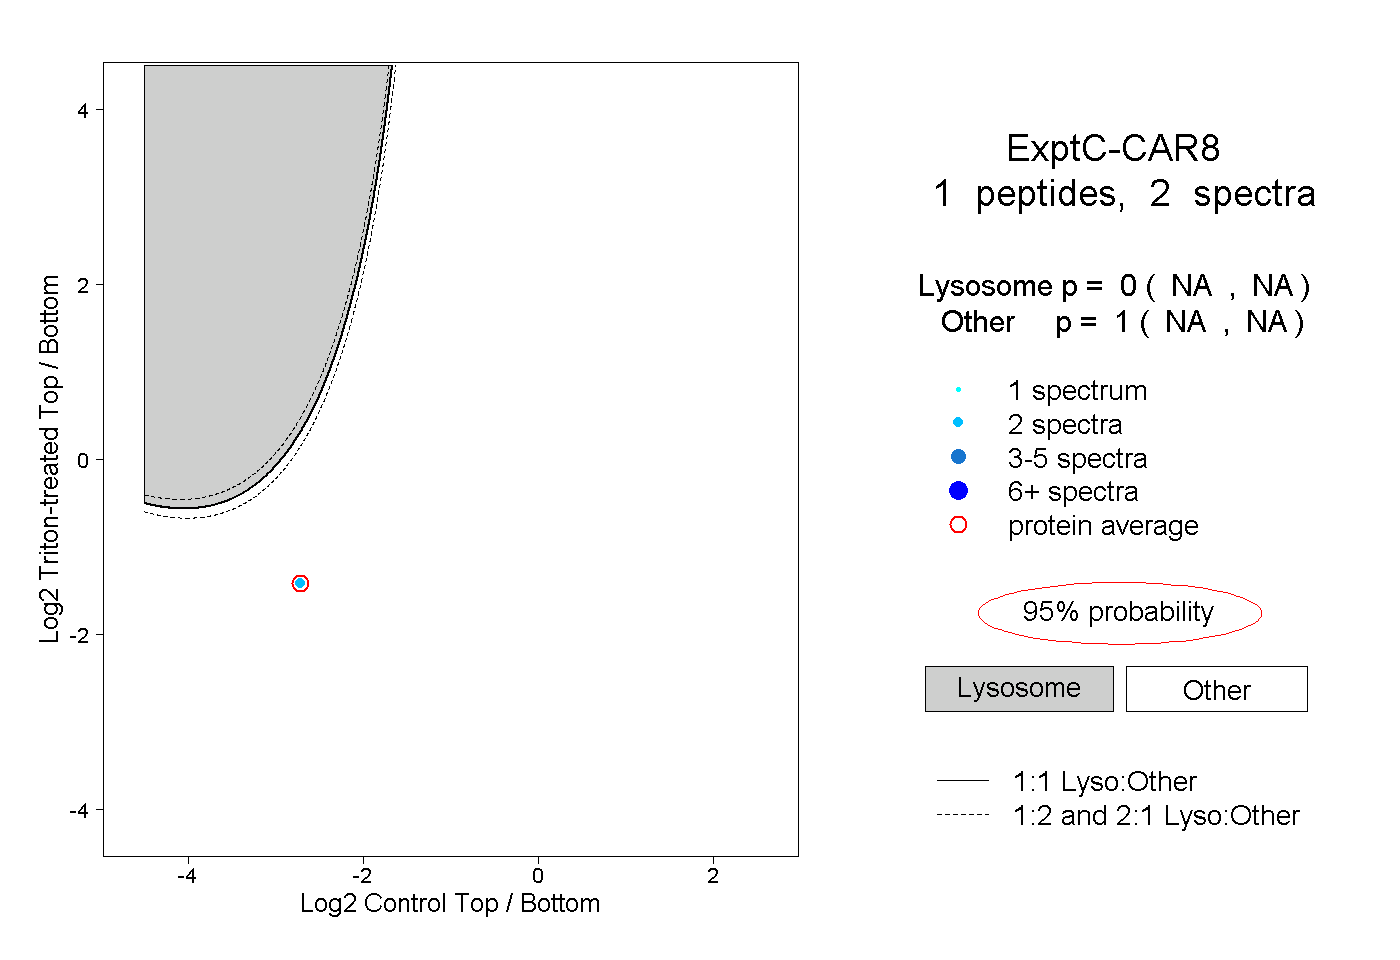
| | | Plot |
|
Lyso |
|
|
|
|
|
|
|
Other |
| Expt C |
1
peptide |
2
spectra |
 |
|
0.000
NA | NA |
|
|
|
|
|
|
|
1.000
NA | NA |