 3
3peptides
spectra
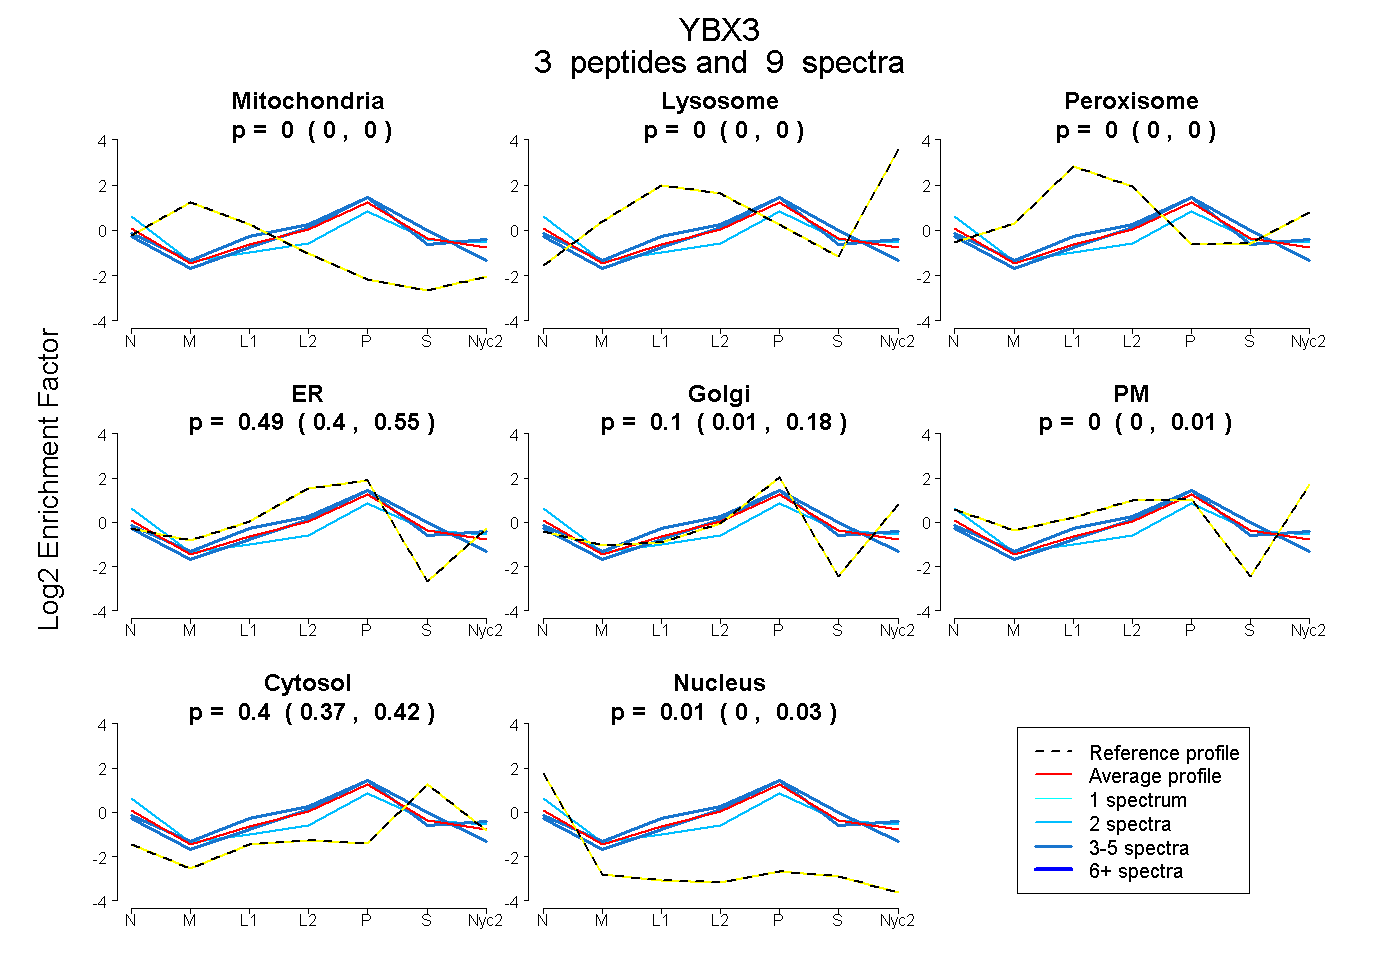
0.000 | 0.000
0.000 | 0.000
0.000 | 0.000
0.400 | 0.554
0.010 | 0.179
0.000 | 0.006
0.370 | 0.423
0.000 | 0.030
1peptide
spectra
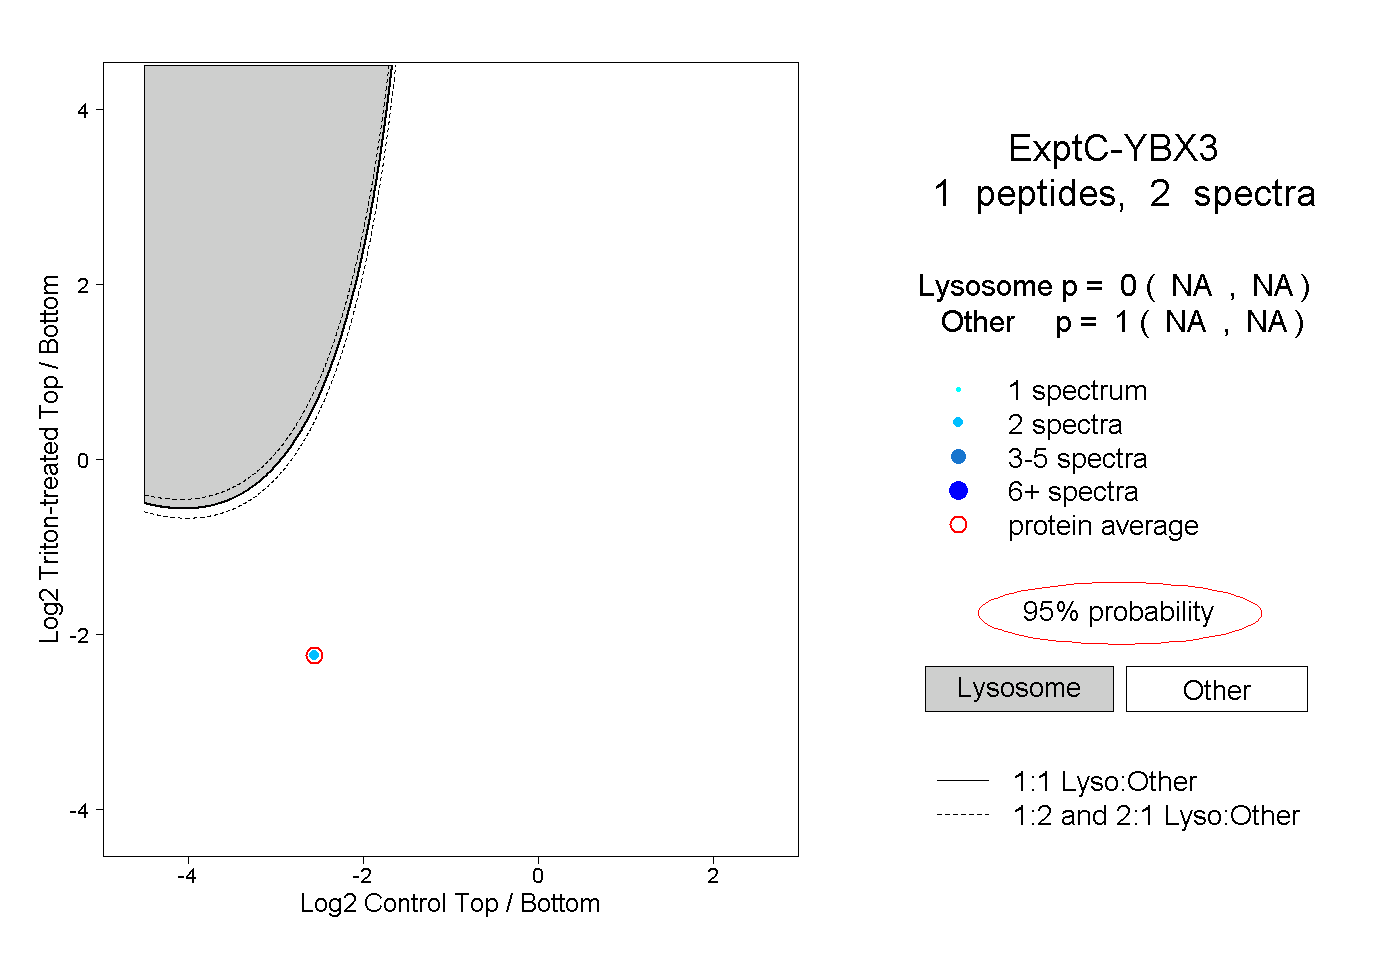
NA | NA
NA | NA
1peptide
spectrum
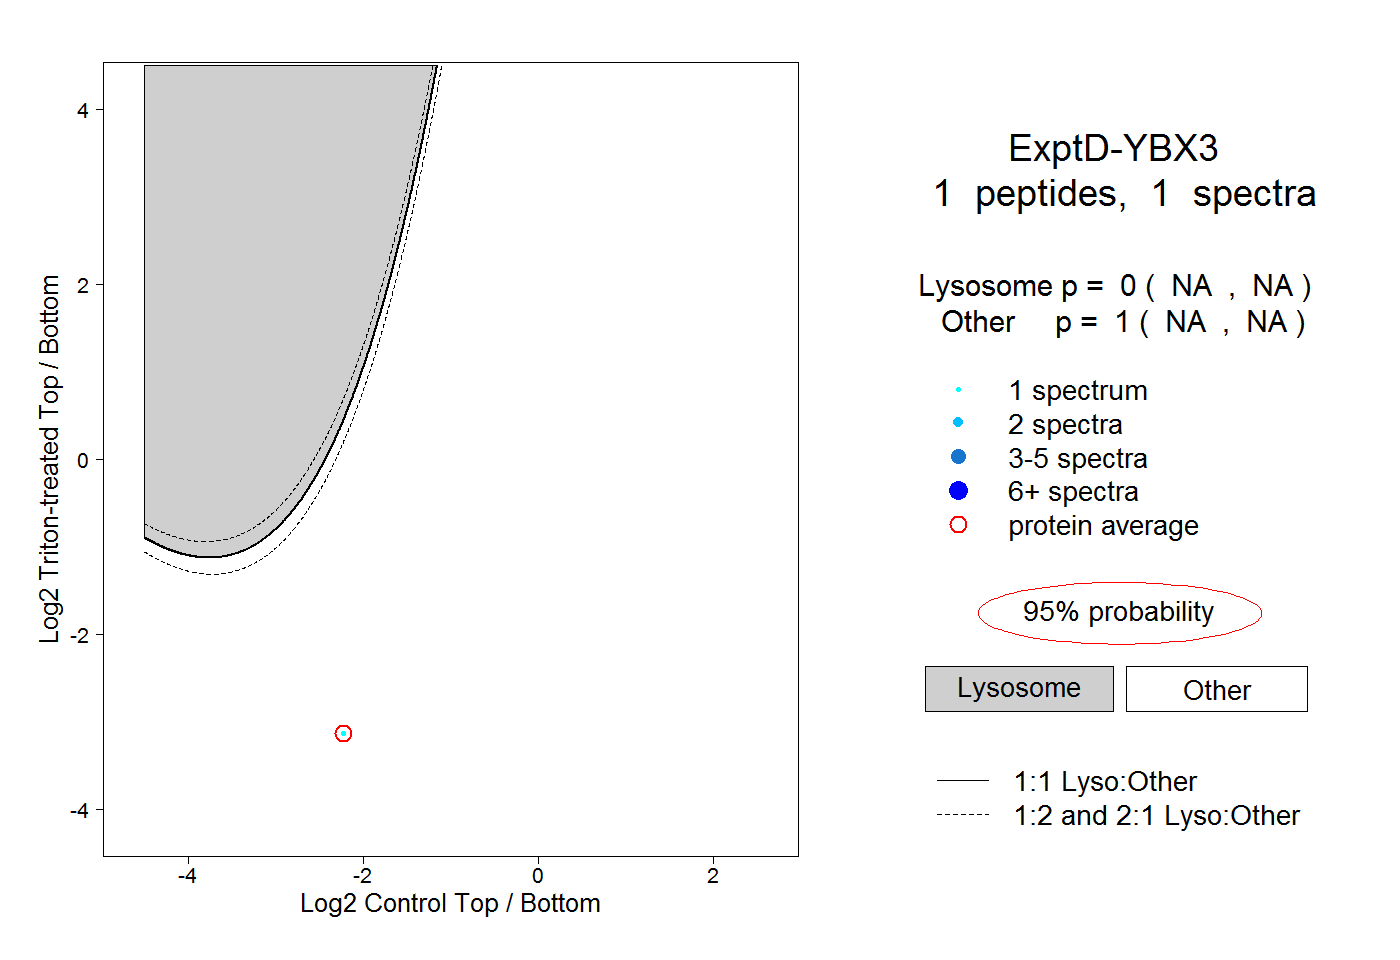
NA | NA
NA | NA