 3
3peptides
spectra
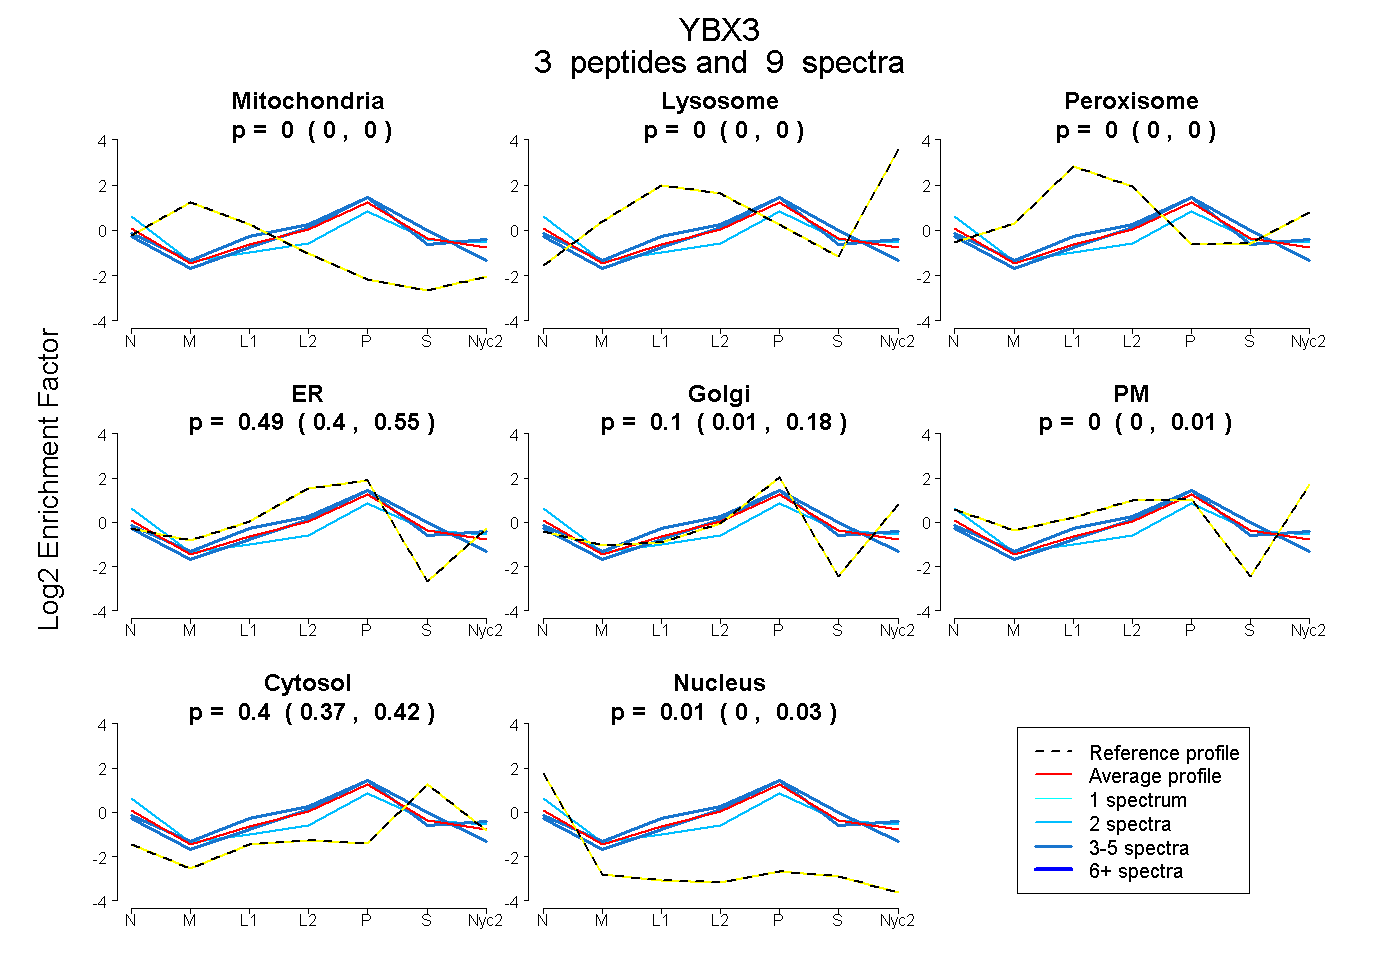
0.000 | 0.000
0.000 | 0.000
0.000 | 0.000
0.400 | 0.554
0.010 | 0.179
0.000 | 0.006
0.370 | 0.423
0.000 | 0.030
| Plot | Mito | Lyso | Perox | ER | Golgi | PM | Cytosol | Nucleus | |||||
| Expt A |
3 peptides |
9 spectra |
|
0.000 0.000 | 0.000 |
0.000 0.000 | 0.000 |
0.000 0.000 | 0.000 |
0.486 0.400 | 0.554 |
0.104 0.010 | 0.179 |
0.000 0.000 | 0.006 |
0.402 0.370 | 0.423 |
0.008 0.000 | 0.030 |
| 3 spectra, YAADR | 0.000 | 0.000 | 0.000 | 0.534 | 0.000 | 0.000 | 0.466 | 0.000 | ||
| 2 spectra, DGVPEGAQLQVHR | 0.000 | 0.000 | 0.000 | 0.127 | 0.242 | 0.174 | 0.354 | 0.102 | ||
| 4 spectra, VFPHPNR | 0.000 | 0.000 | 0.039 | 0.472 | 0.170 | 0.000 | 0.319 | 0.000 |
| Plot | Lyso | Other | |||||||||||
| Expt C |
1 peptide |
2 spectra |
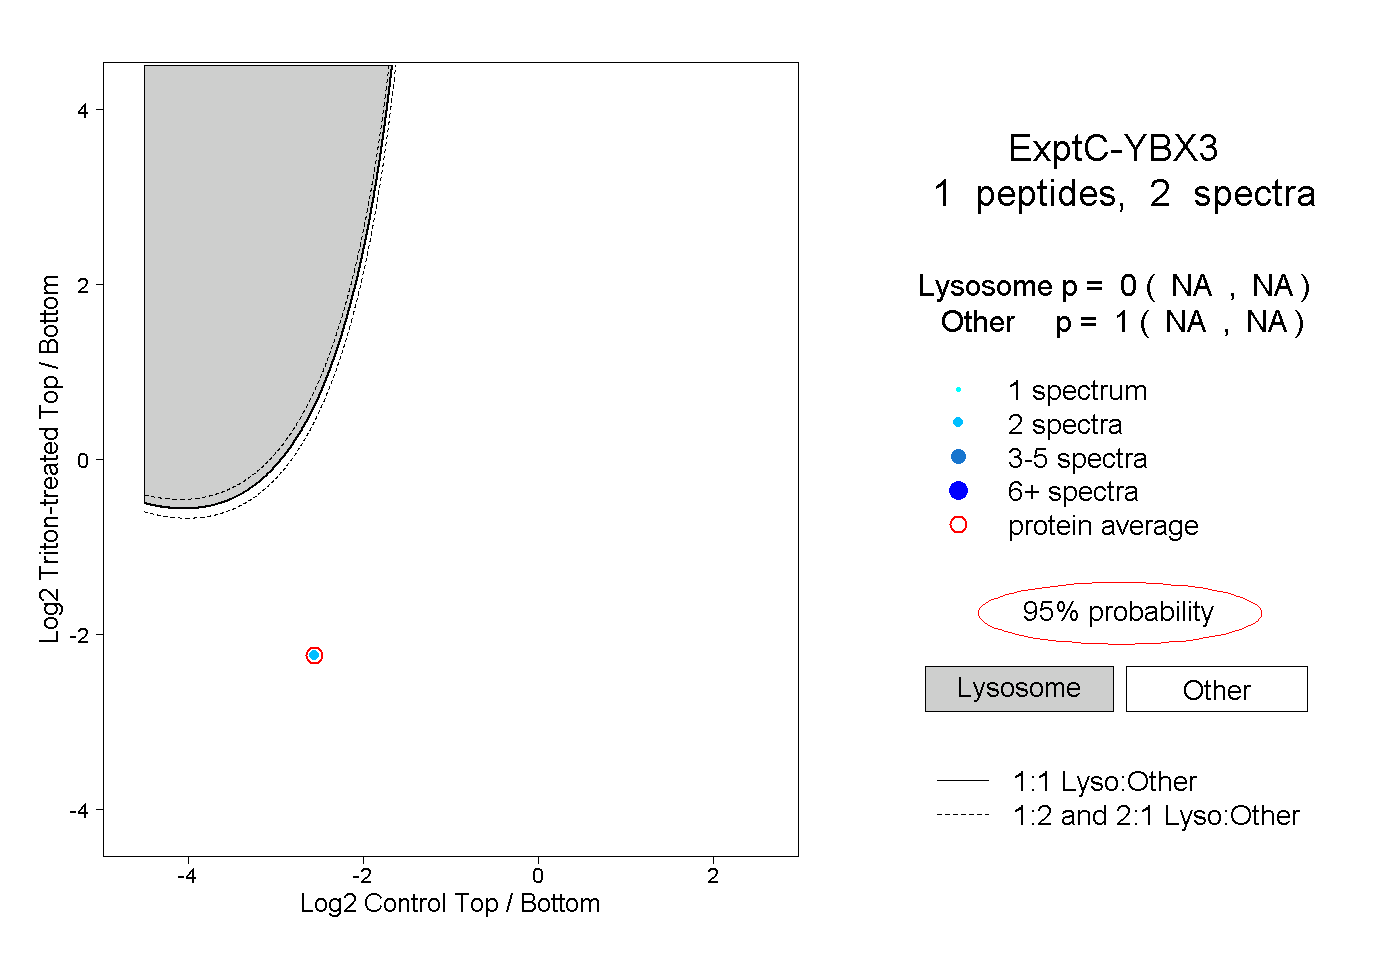 |
0.000 NA | NA |
1.000 NA | NA |
||||||||
| Plot | Lyso | Other | |||||||||||
| Expt D |
1 peptide |
1 spectrum |
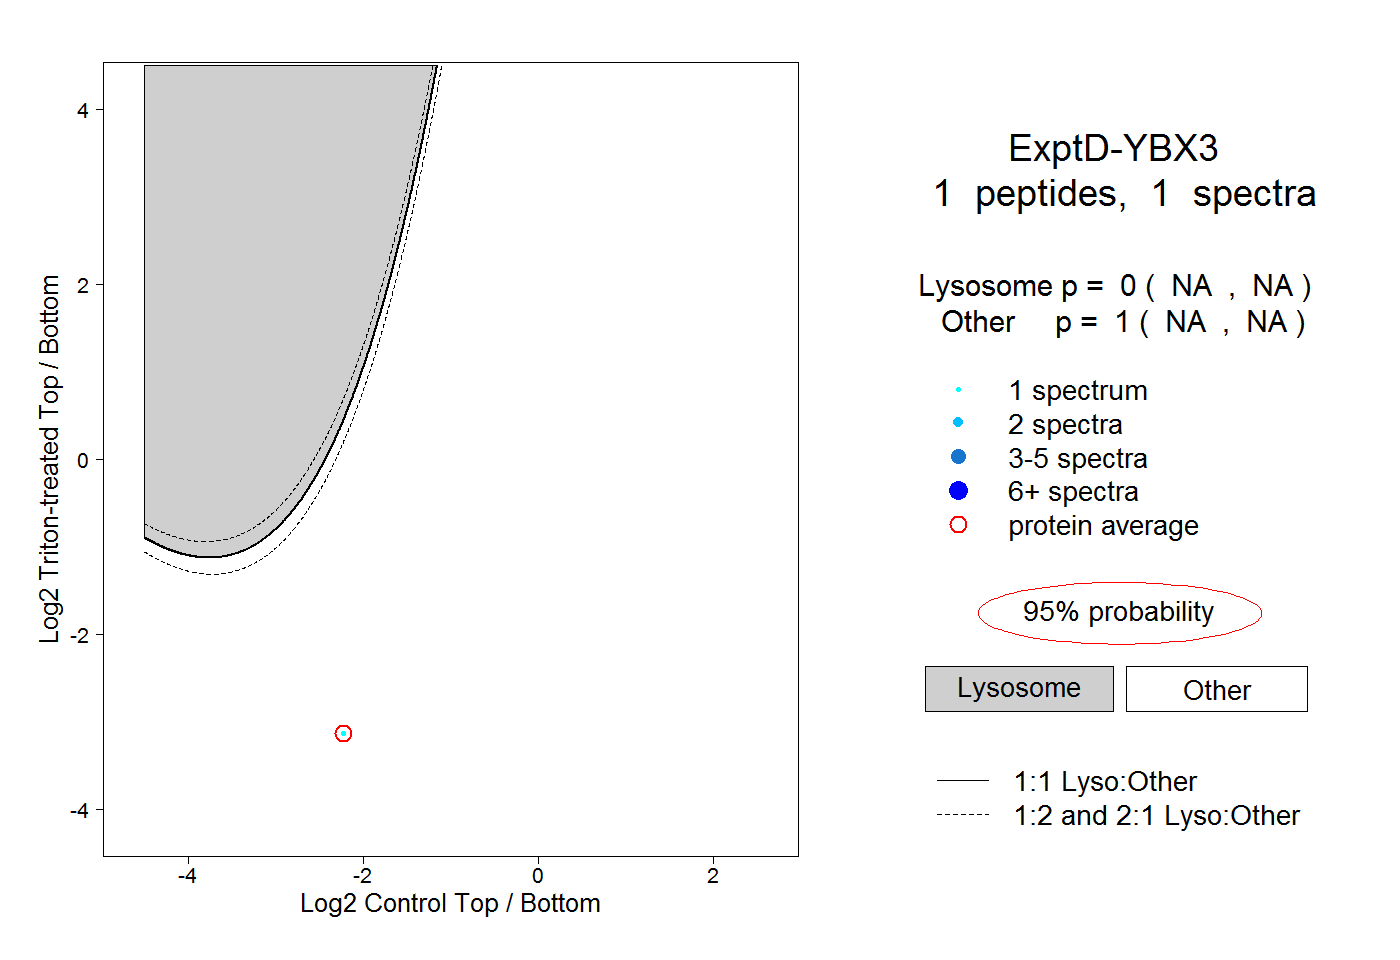 |
0.000 NA | NA |
1.000 NA | NA |