 4
4peptides
spectra
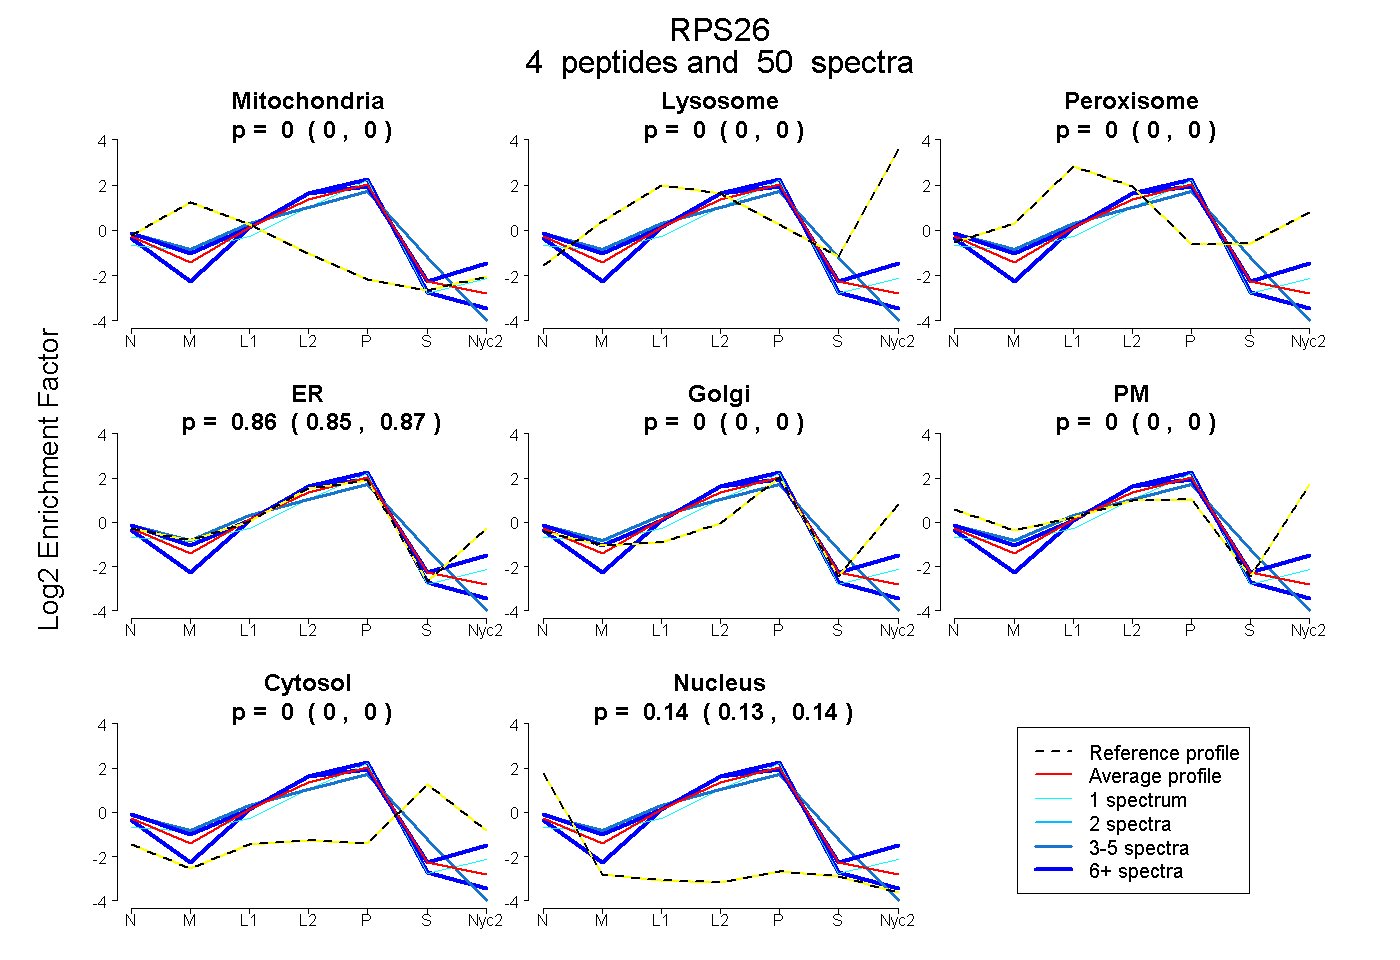
0.000 | 0.000
0.000 | 0.000
0.000 | 0.000
0.853 | 0.871
0.000 | 0.000
0.000 | 0.000
0.000 | 0.000
0.128 | 0.145
2peptides
spectra
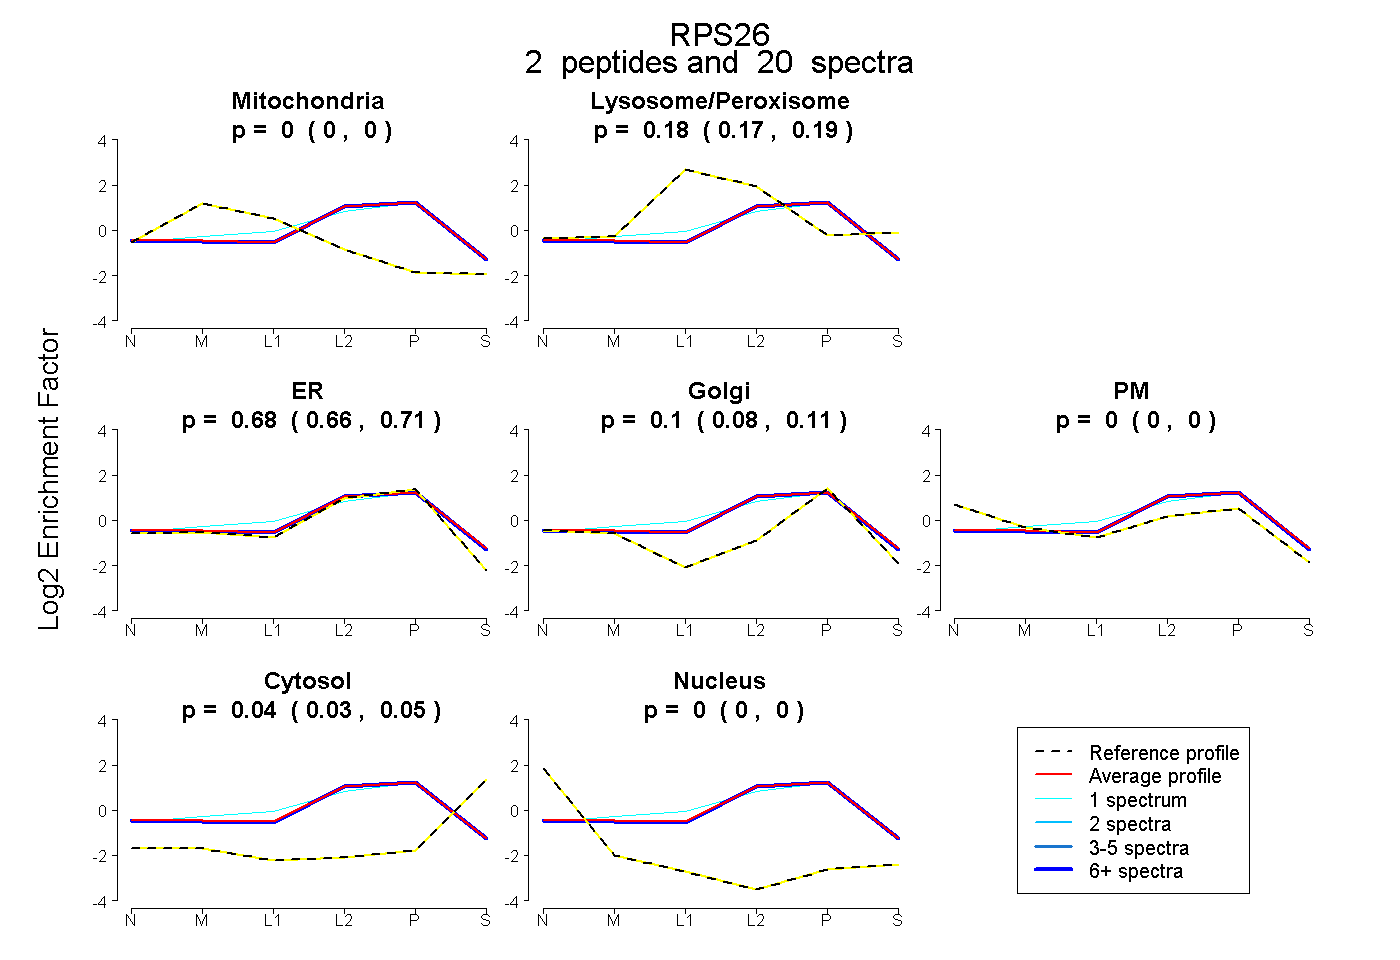
0.000 | 0.000
0.167 | 0.187
0.659 | 0.708
0.076 | 0.112
0.000 | 0.000
0.033 | 0.047
0.000 | 0.000
4peptides
spectra
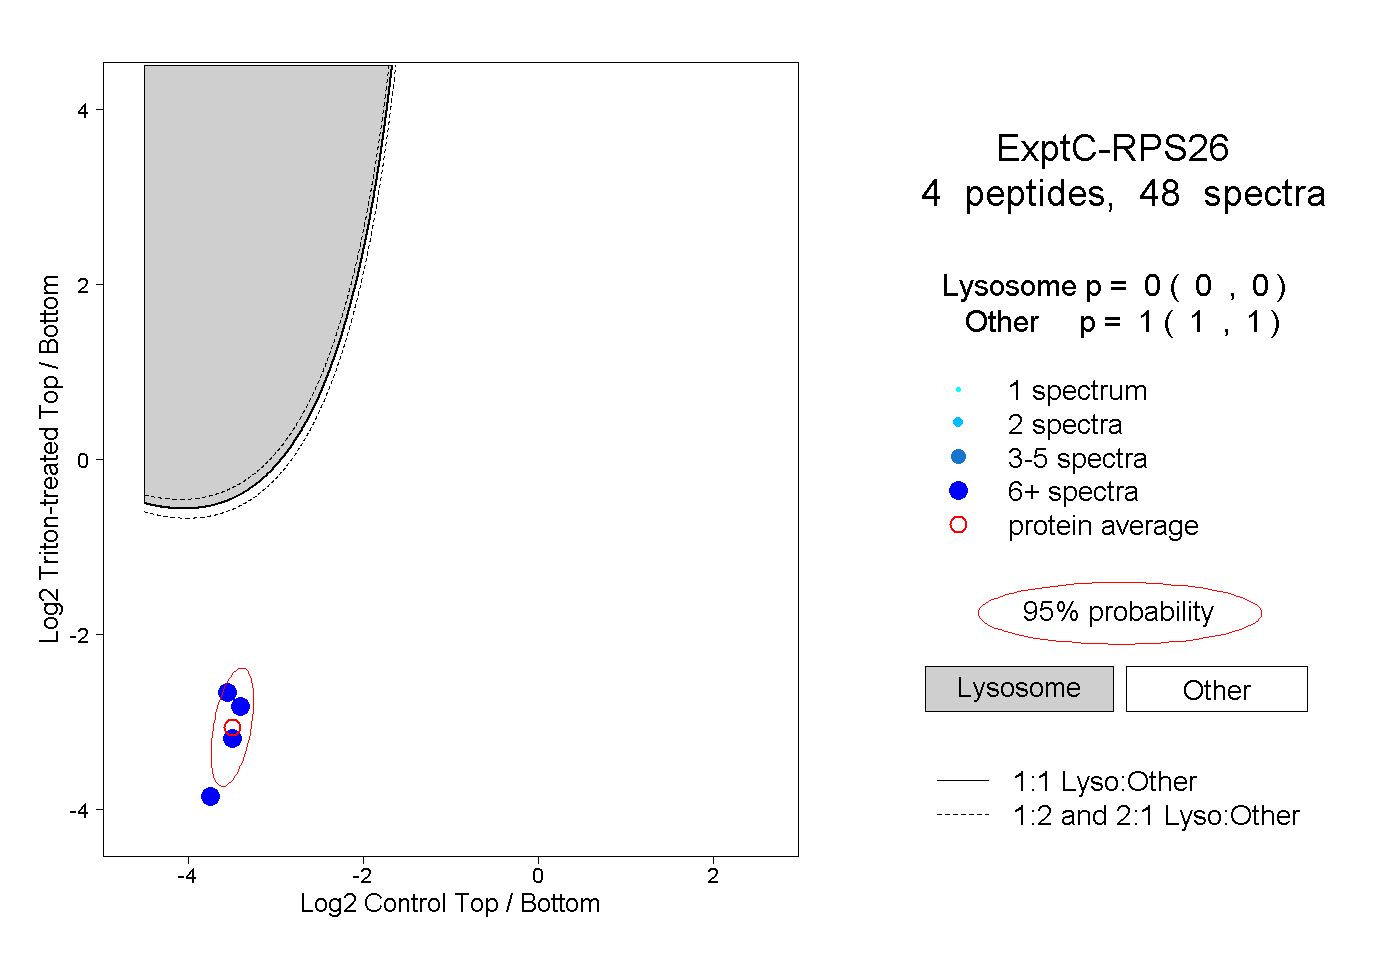
0.000 | 0.000
1.000 | 1.000
2peptides
spectra

0.000 | 0.000
1.000 | 1.000