 4
4peptides
spectra
0.000 | 0.000
0.000 | 0.000
0.000 | 0.000
0.853 | 0.871
0.000 | 0.000
0.000 | 0.000
0.000 | 0.000
0.128 | 0.145
| Plot | Mito | Lyso | Perox | ER | Golgi | PM | Cytosol | Nucleus | |||||
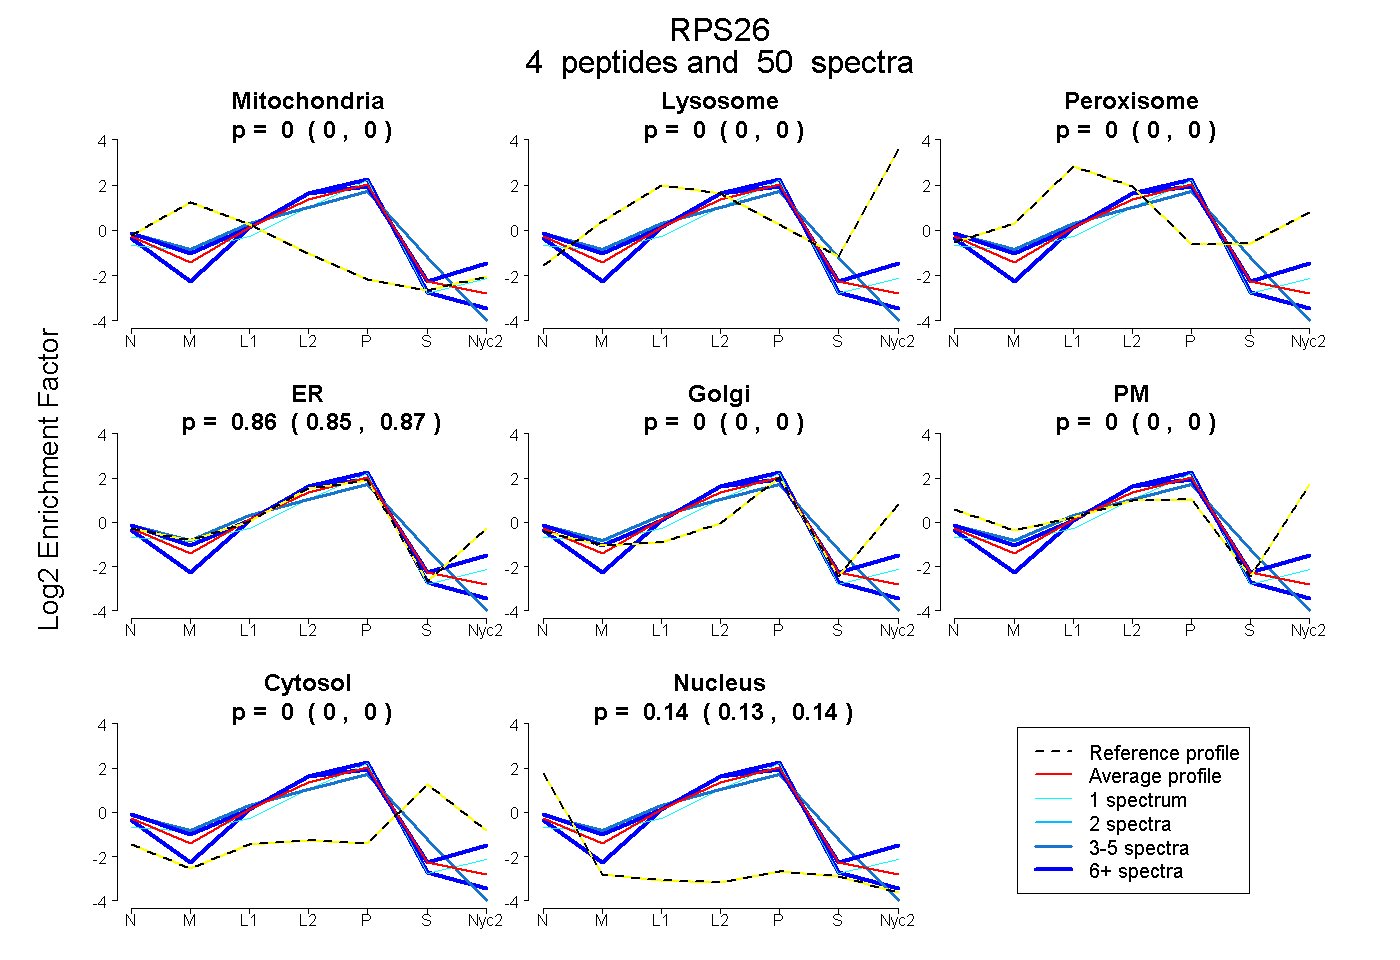
| Expt A |
4 peptides |
50 spectra |
|
0.000 0.000 | 0.000 |
0.000 0.000 | 0.000 |
0.000 0.000 | 0.000 |
0.863 0.853 | 0.871 |
0.000 0.000 | 0.000 |
0.000 0.000 | 0.000 |
0.000 0.000 | 0.000 |
0.137 0.128 | 0.145 |
| 4 spectra, LHYCVSCAIHSK | 0.113 | 0.000 | 0.000 | 0.692 | 0.000 | 0.000 | 0.073 | 0.123 | ||
| 1 spectrum, GHVQPIR | 0.000 | 0.000 | 0.000 | 0.894 | 0.000 | 0.000 | 0.000 | 0.106 | ||
| 33 spectra, FRPAGAAPRPPPKPM | 0.000 | 0.000 | 0.000 | 0.841 | 0.000 | 0.000 | 0.000 | 0.159 | ||
| 12 spectra, NIVEAAAVR | 0.000 | 0.000 | 0.000 | 0.944 | 0.000 | 0.000 | 0.001 | 0.055 |
| Plot | Mito | Lyso or Perox | ER | Golgi | PM | Cytosol | Nucleus | ||||||
| Expt B |
2 peptides |
20 spectra |
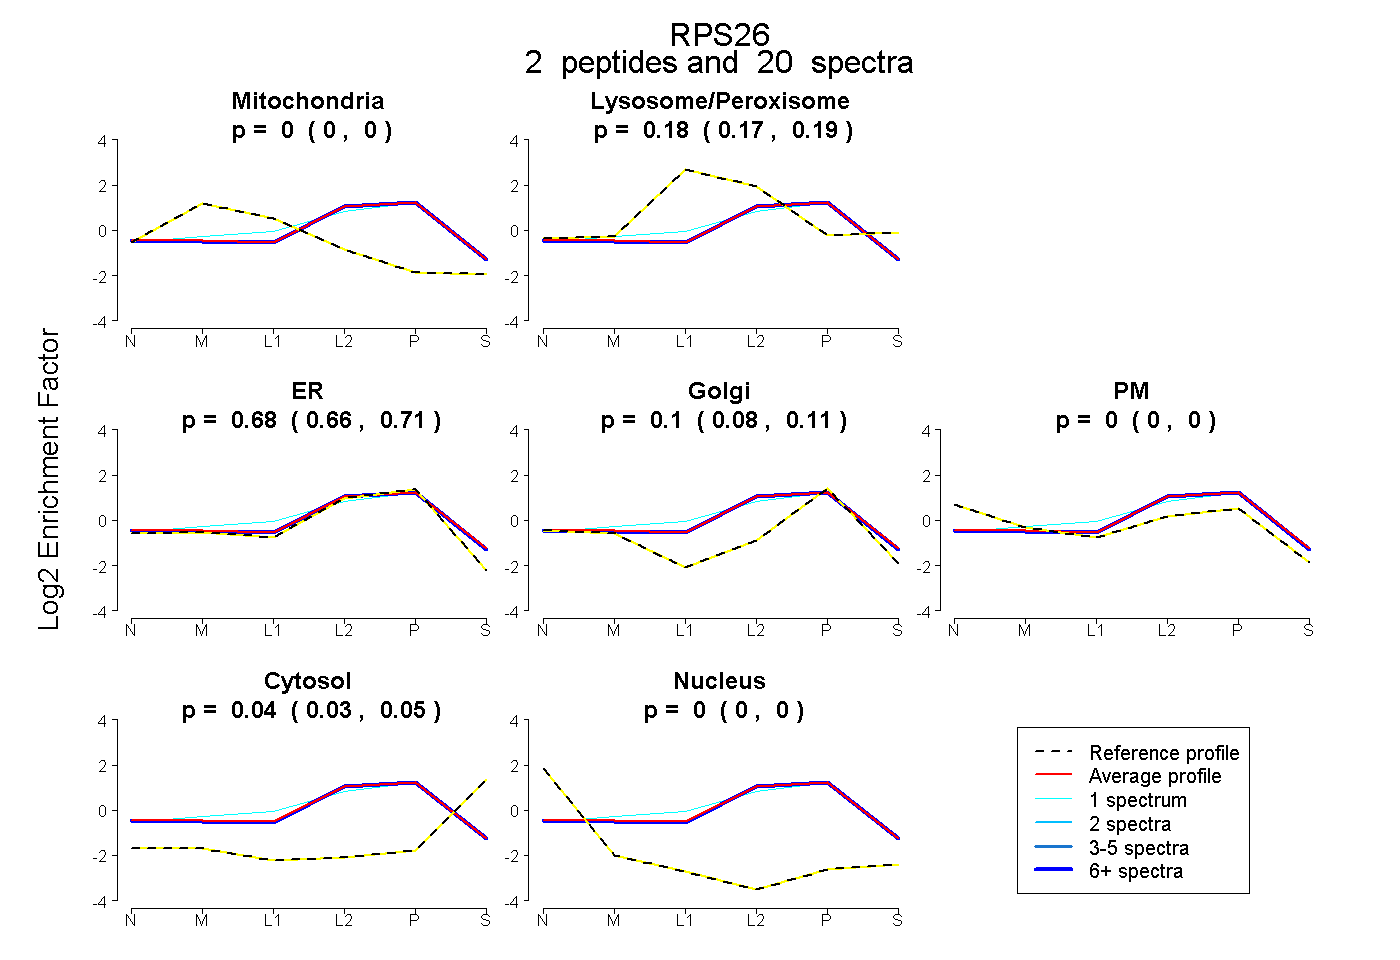 |
0.000 0.000 | 0.000 |
0.178 0.167 | 0.187 |
0.685 0.659 | 0.708 |
0.096 0.076 | 0.112 |
0.000 0.000 | 0.000 |
0.041 0.033 | 0.047 |
0.000 0.000 | 0.000 |
|||
| Plot | Lyso | Other | |||||||||||
| Expt C |
4 peptides |
48 spectra |
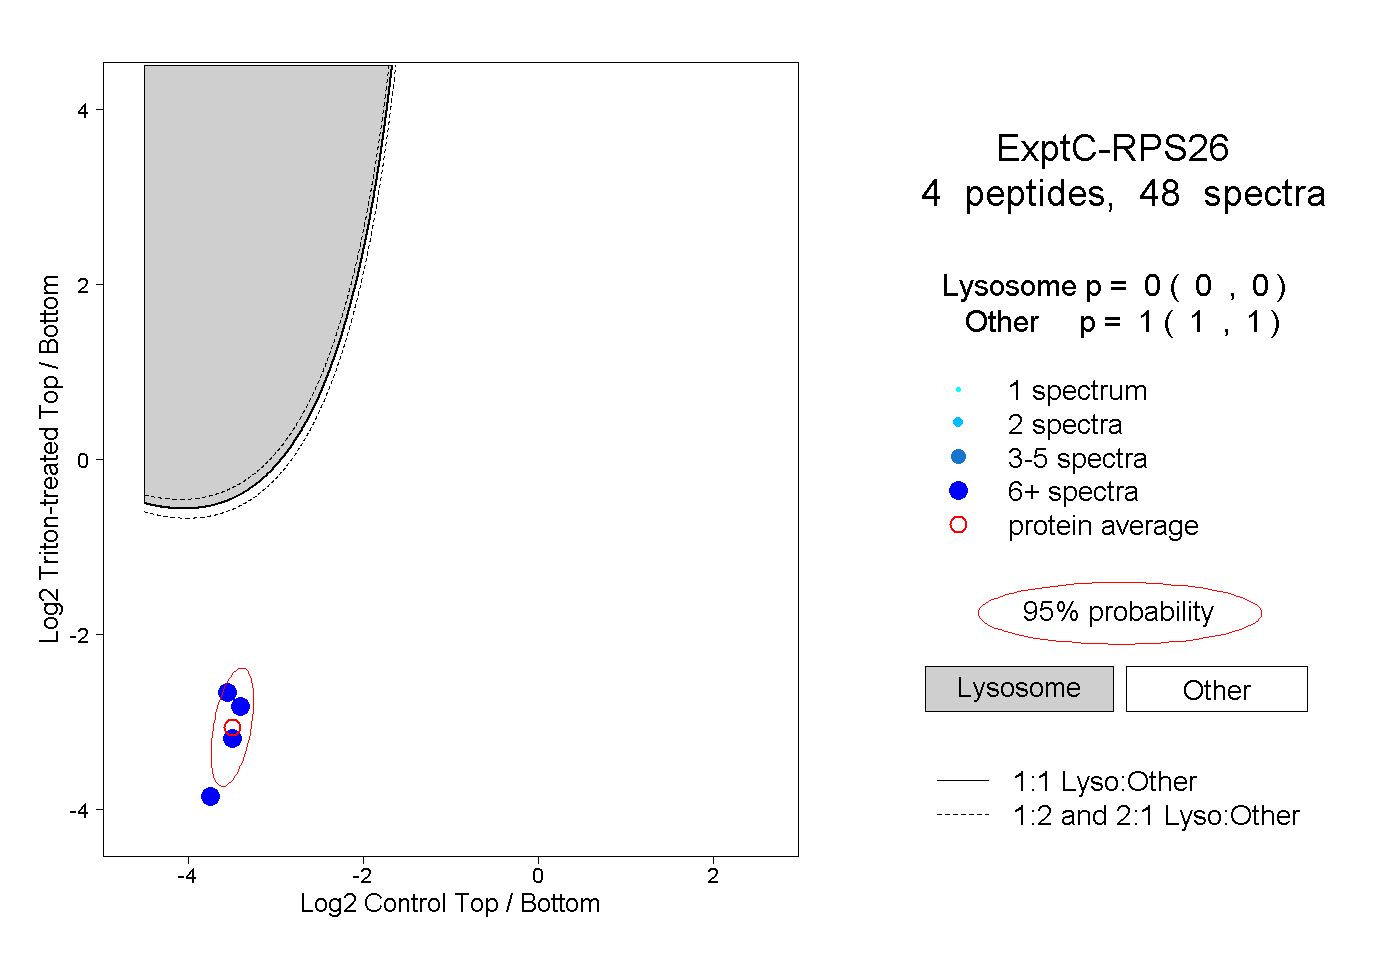 |
0.000 0.000 | 0.000 |
1.000 1.000 | 1.000 |
||||||||
| Plot | Lyso | Other | |||||||||||
| Expt D |
2 peptides |
7 spectra |
 |
0.000 0.000 | 0.000 |
1.000 1.000 | 1.000 |