 3
3peptides
spectra
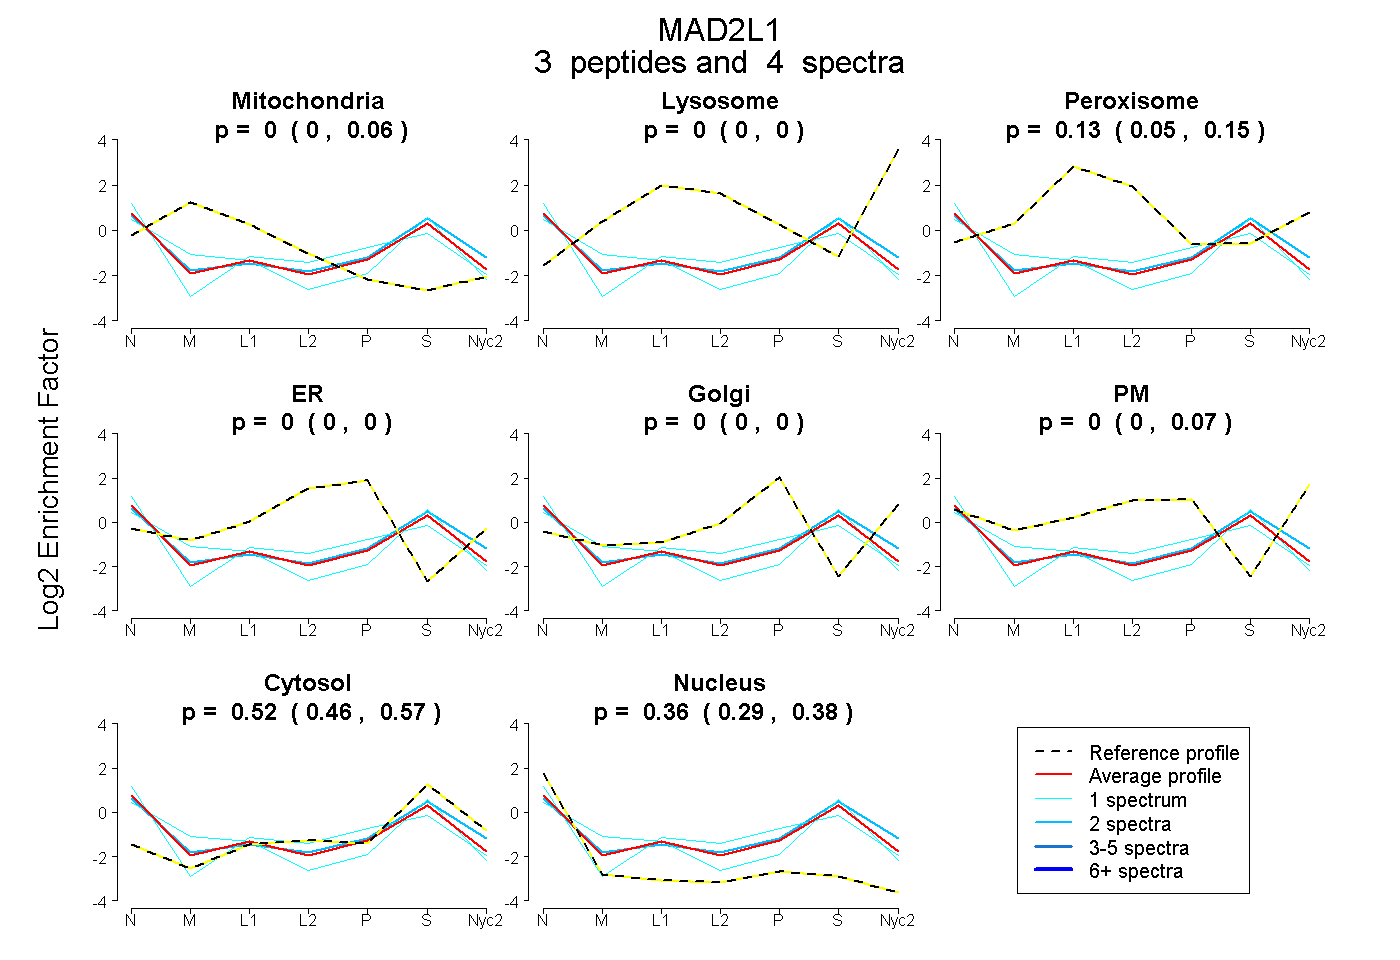
0.000 | 0.059
0.000 | 0.000
0.047 | 0.150
0.000 | 0.000
0.000 | 0.000
0.000 | 0.068
0.460 | 0.571
0.290 | 0.382
1peptide
spectrum
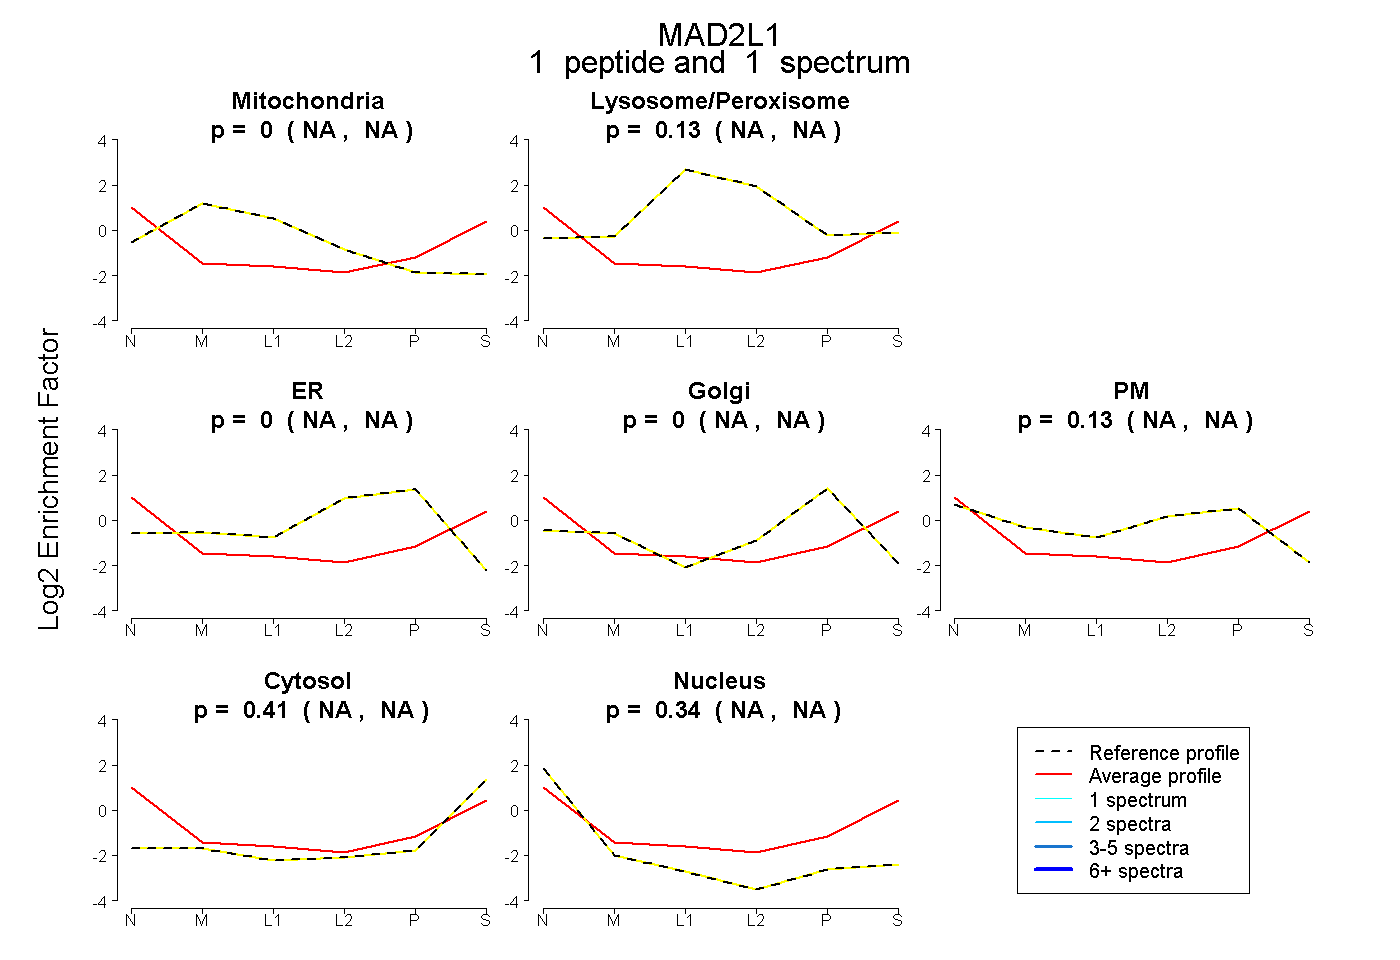
NA | NA
NA | NA
NA | NA
NA | NA
NA | NA
NA | NA
NA | NA
1peptide
spectrum
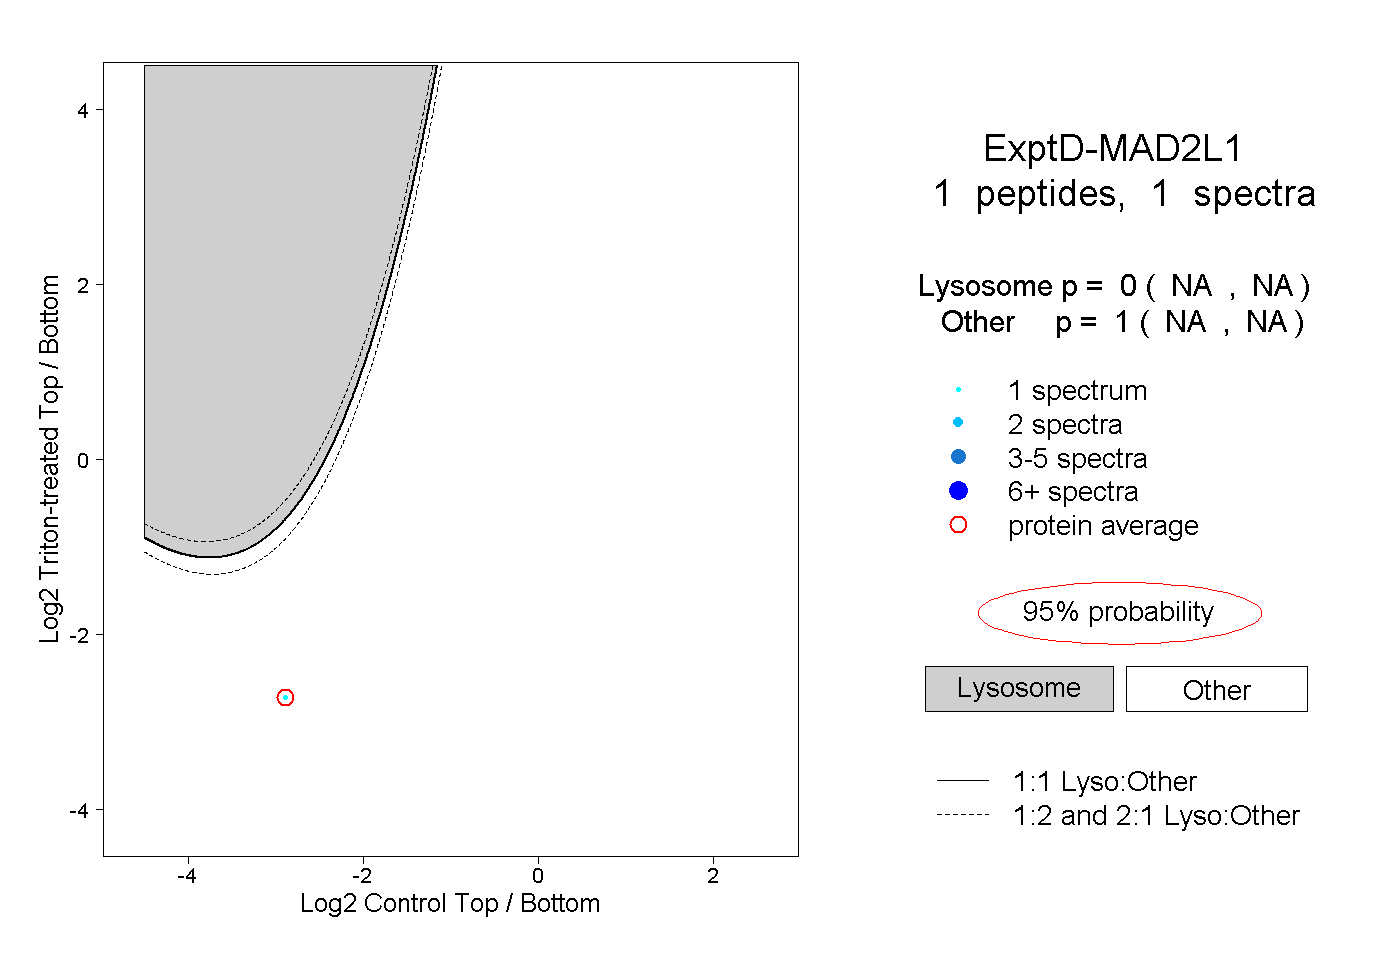
NA | NA
NA | NA