 3
3peptides
spectra
0.000 | 0.059
0.000 | 0.000
0.047 | 0.150
0.000 | 0.000
0.000 | 0.000
0.000 | 0.068
0.460 | 0.571
0.290 | 0.382
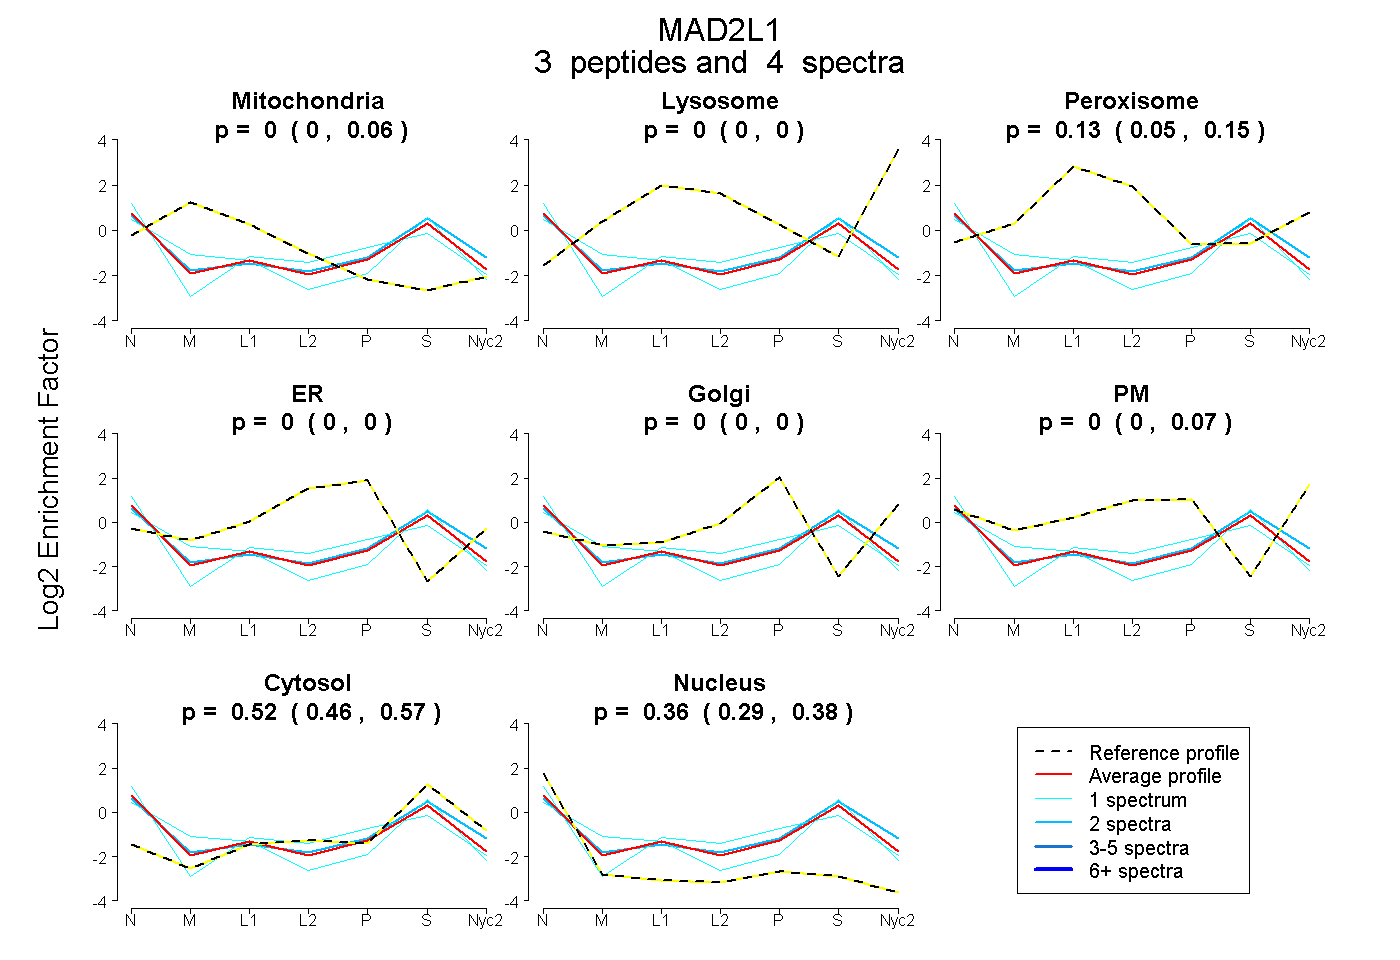
| Plot | Mito | Lyso | Perox | ER | Golgi | PM | Cytosol | Nucleus | |||||
| Expt A |
3 peptides |
4 spectra |
|
0.000 0.000 | 0.059 |
0.000 0.000 | 0.000 |
0.126 0.047 | 0.150 |
0.000 0.000 | 0.000 |
0.000 0.000 | 0.000 |
0.000 0.000 | 0.068 |
0.519 0.460 | 0.571 |
0.355 0.290 | 0.382 |
| 1 spectrum, ALEDIER | 0.000 | 0.000 | 0.059 | 0.127 | 0.000 | 0.000 | 0.444 | 0.371 | ||
| 1 spectrum, WQFDIECDK | 0.196 | 0.000 | 0.000 | 0.000 | 0.000 | 0.000 | 0.543 | 0.261 | ||
| 2 spectra, AIQDEIR | 0.000 | 0.000 | 0.042 | 0.000 | 0.000 | 0.101 | 0.596 | 0.261 |
| Plot | Mito | Lyso or Perox | ER | Golgi | PM | Cytosol | Nucleus | ||||||
| Expt B |
1 peptide |
1 spectrum |
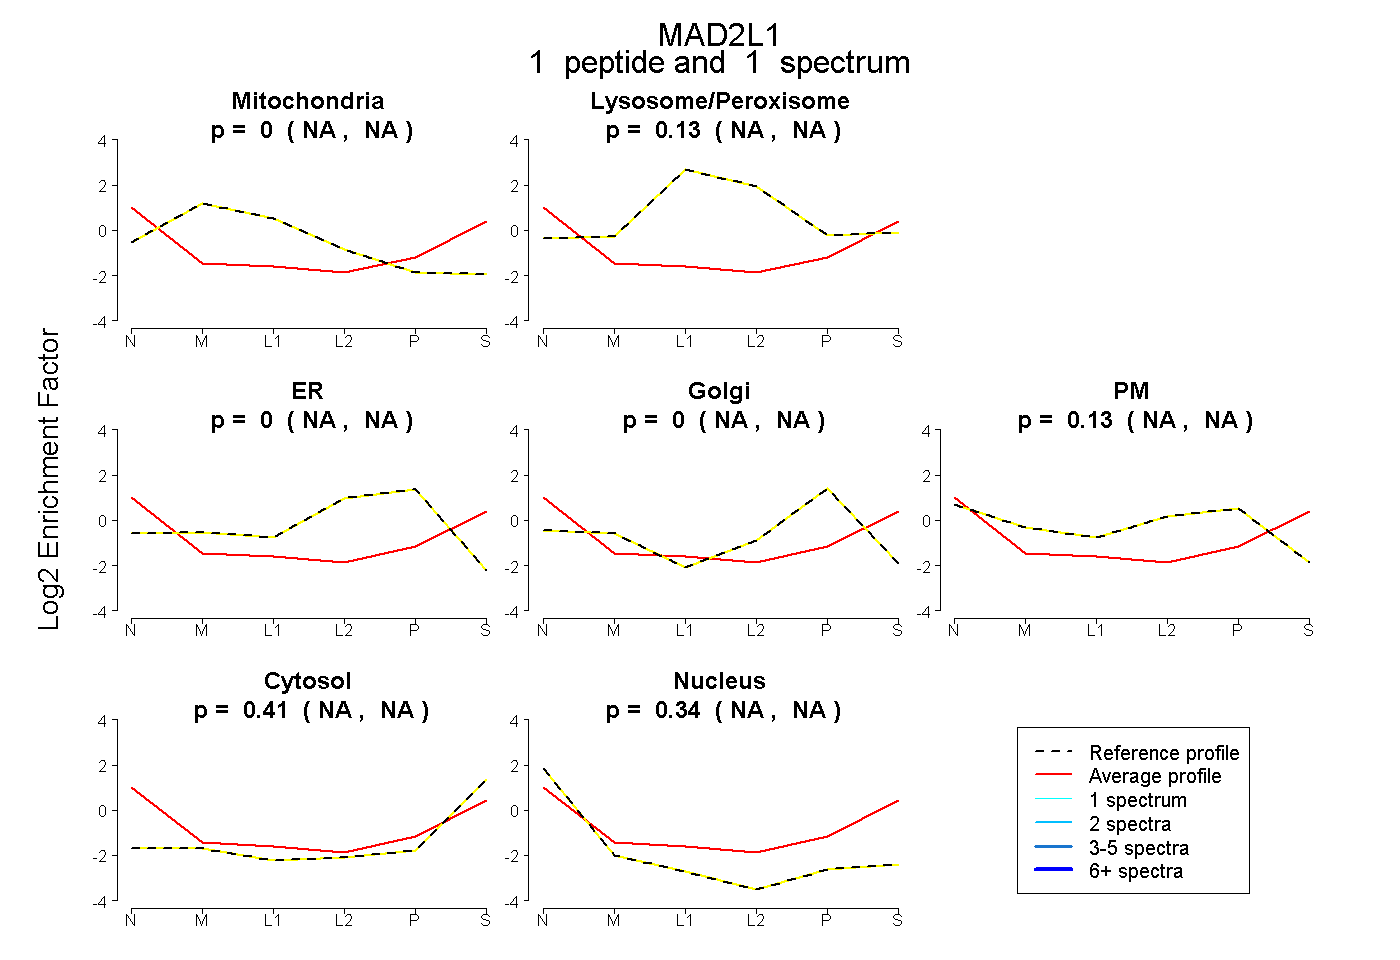 |
0.000 NA | NA |
0.127 NA | NA |
0.000 NA | NA |
0.000 NA | NA |
0.128 NA | NA |
0.405 NA | NA |
0.340 NA | NA |
|||
| Plot | Lyso | Other | |||||||||||
| Expt D |
1 peptide |
1 spectrum |
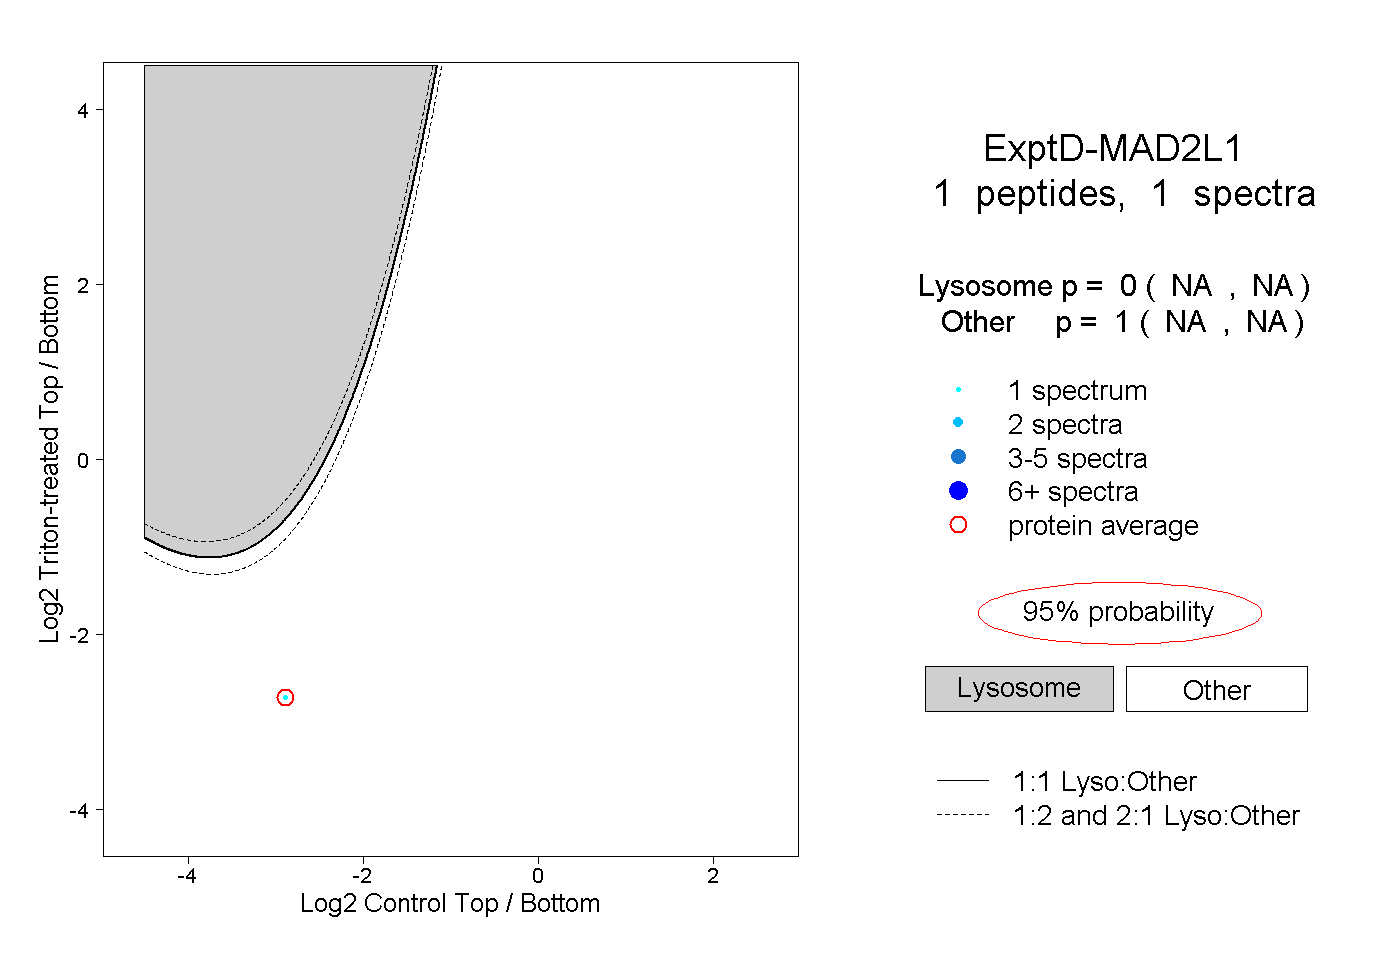 |
0.000 NA | NA |
1.000 NA | NA |