 24
24peptides
spectra
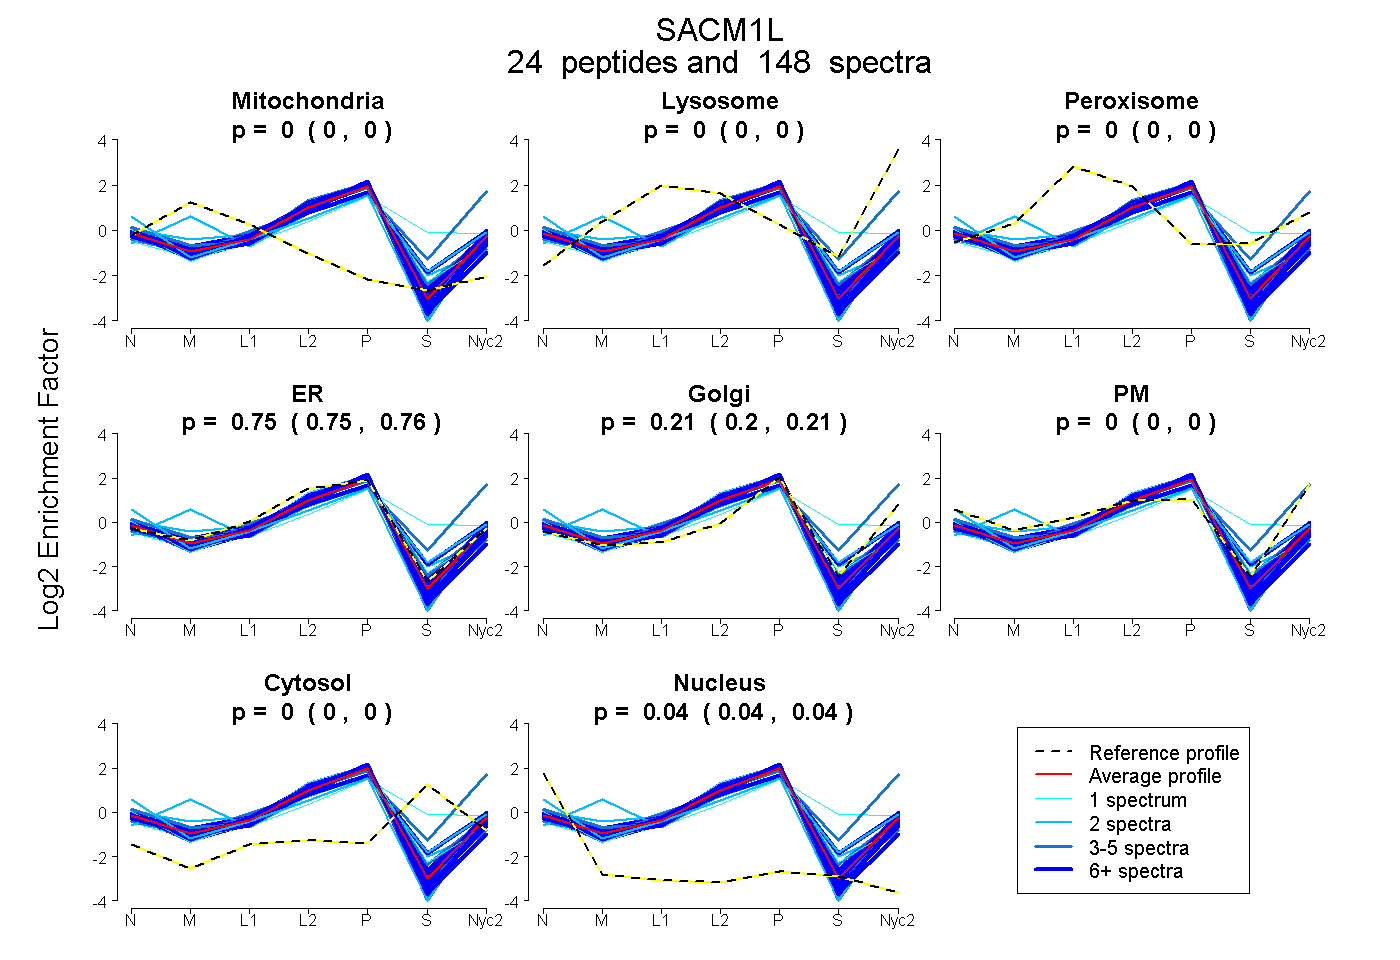
0.000 | 0.000
0.000 | 0.000
0.000 | 0.000
0.747 | 0.756
0.201 | 0.211
0.000 | 0.000
0.000 | 0.000
0.040 | 0.043
16peptides
spectra
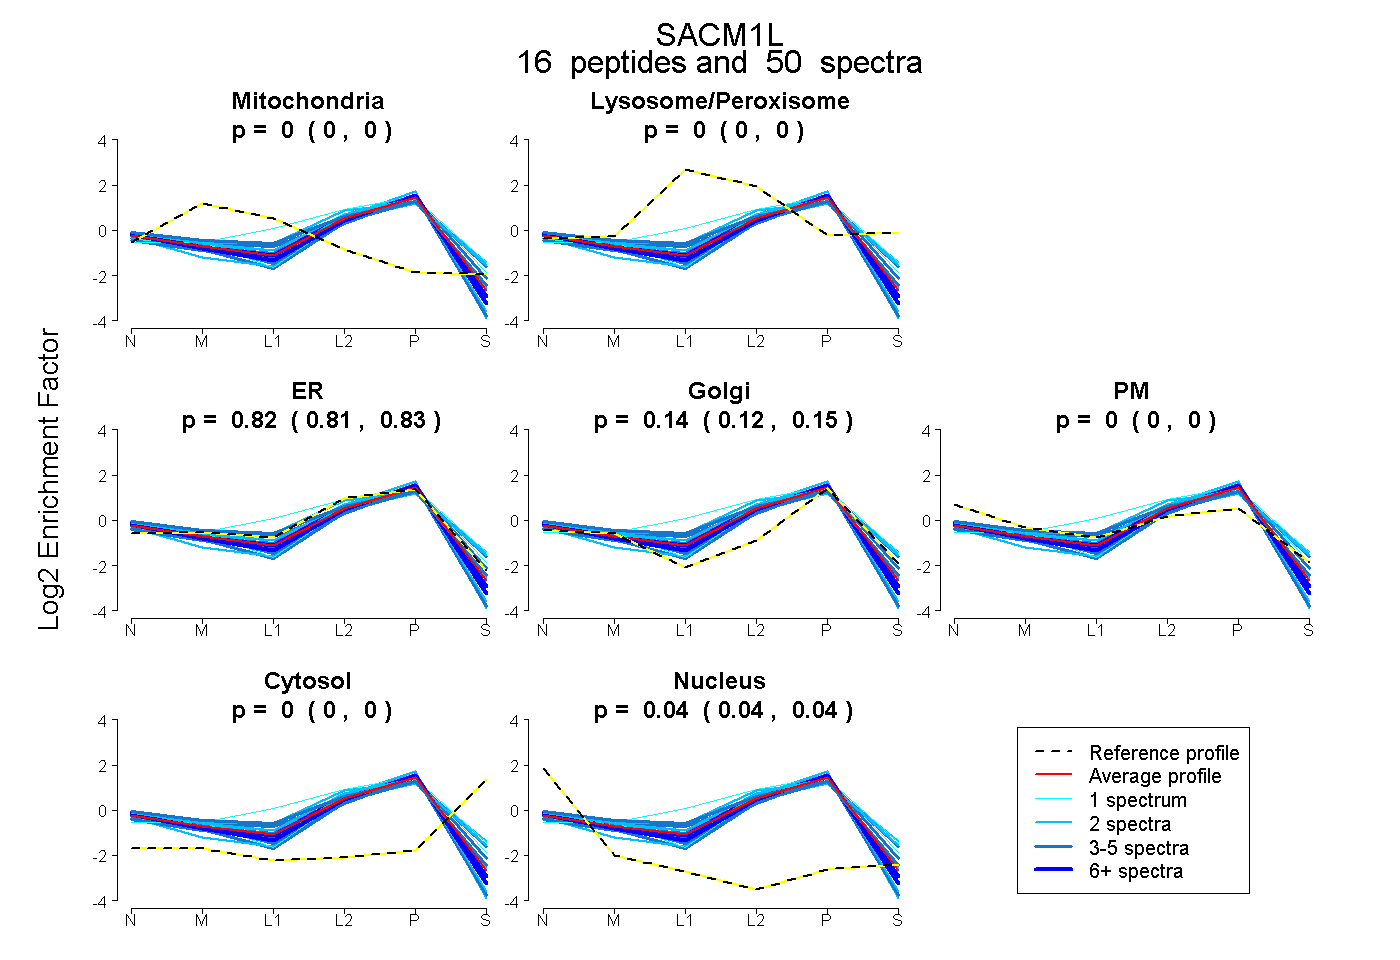
0.000 | 0.000
0.000 | 0.000
0.812 | 0.831
0.125 | 0.148
0.000 | 0.000
0.000 | 0.000
0.038 | 0.043
26peptides
spectra
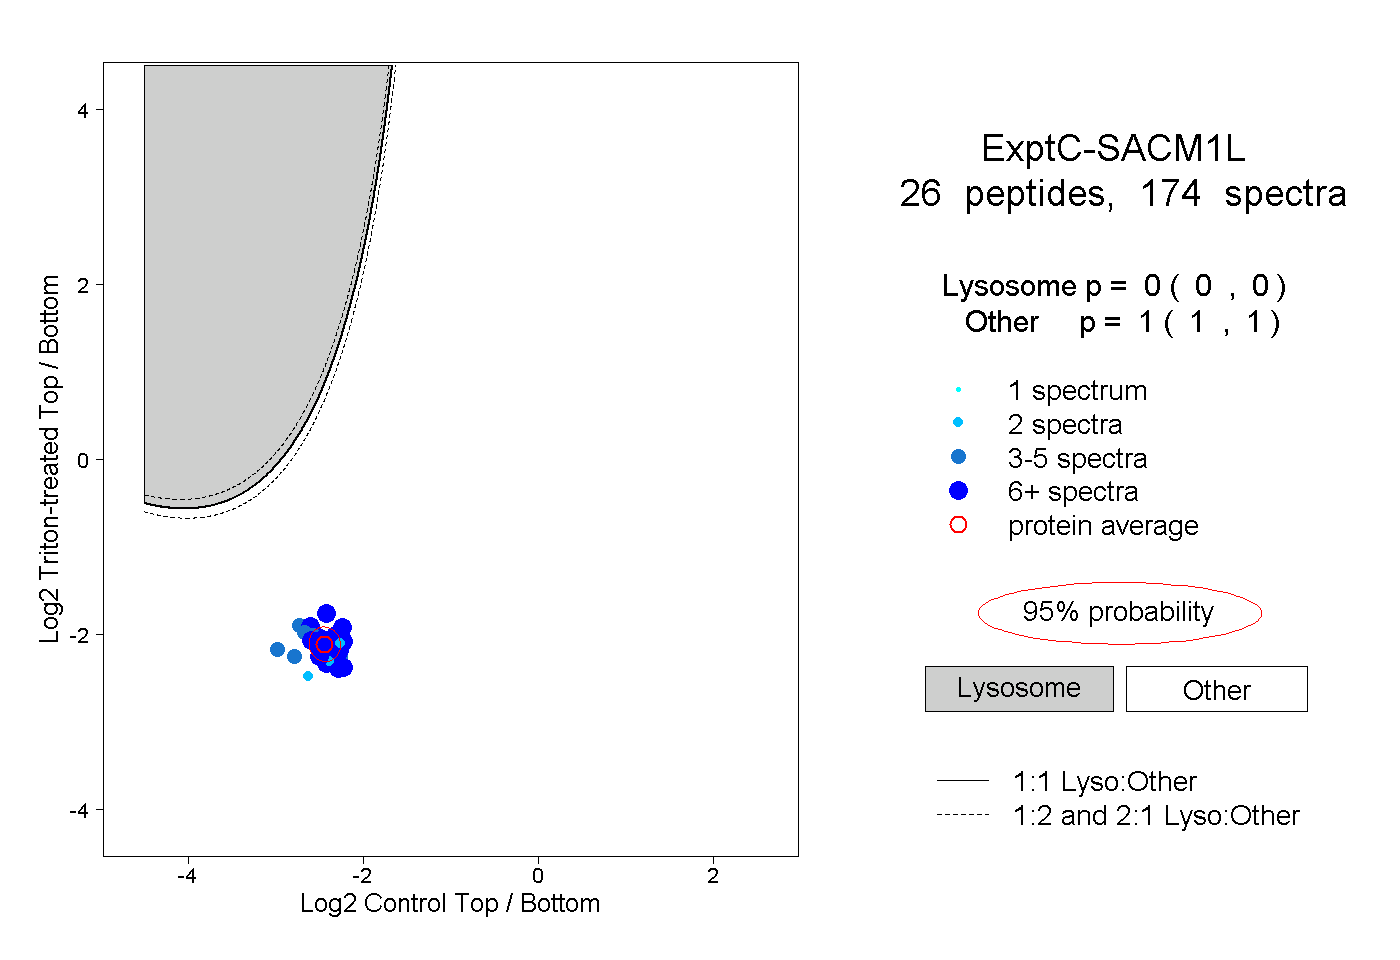
0.000 | 0.000
1.000 | 1.000
12peptides
spectra
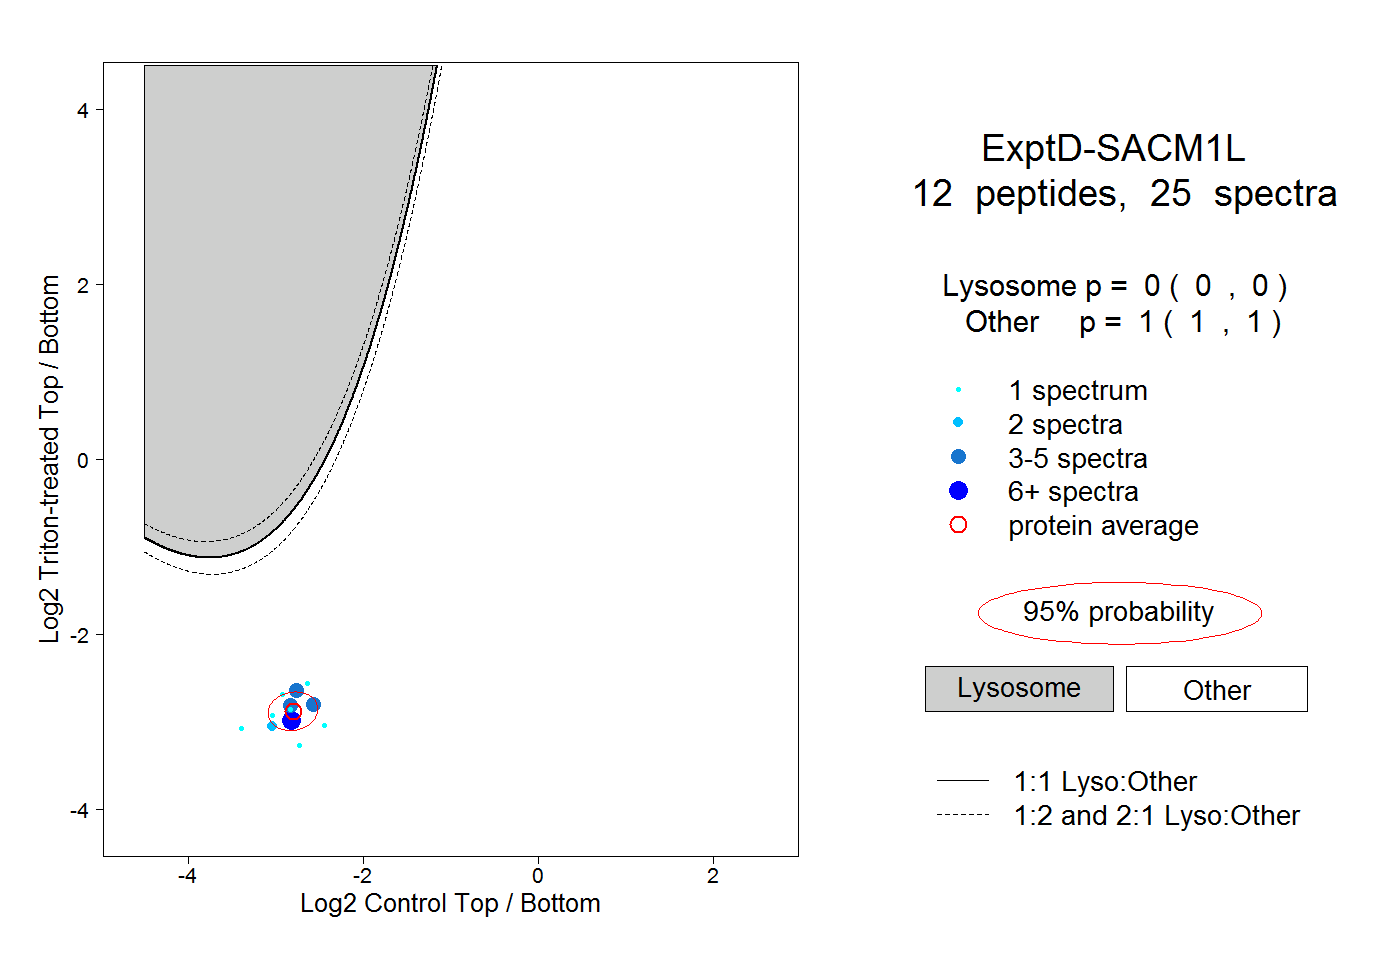
0.000 | 0.000
1.000 | 1.000