 10
10peptides
spectra

0.740 | 0.799
0.000 | 0.081
0.035 | 0.136
0.000 | 0.051
0.000 | 0.000
0.043 | 0.131
0.000 | 0.000
0.000 | 0.000
4peptides
spectra
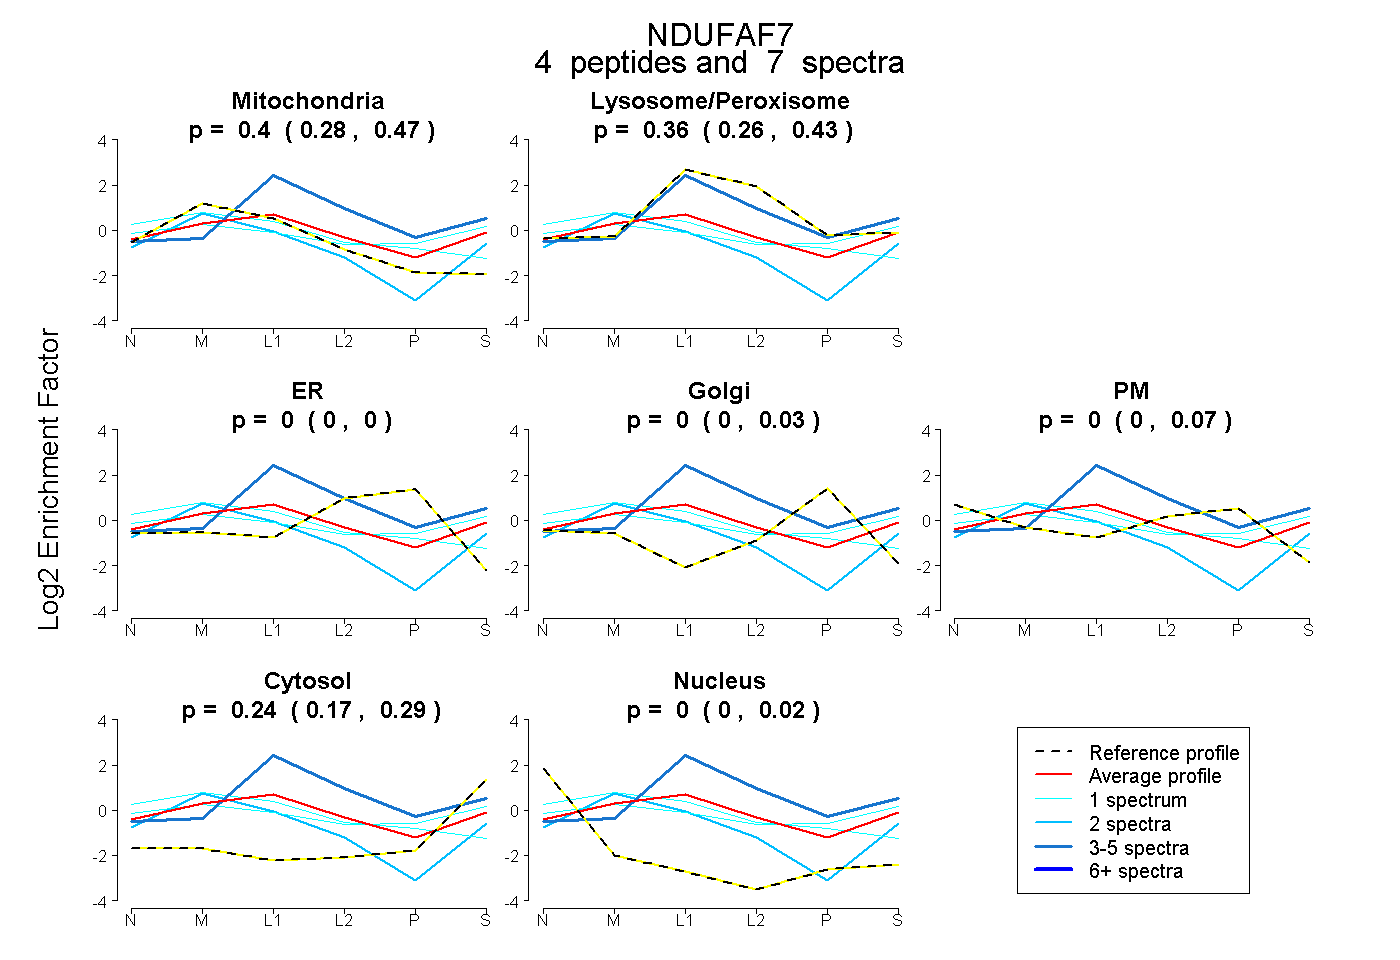
0.283 | 0.471
0.262 | 0.435
0.000 | 0.000
0.000 | 0.026
0.000 | 0.073
0.168 | 0.292
0.000 | 0.023
13peptides
spectra

0.000 | 0.000
1.000 | 1.000
2peptides
spectra
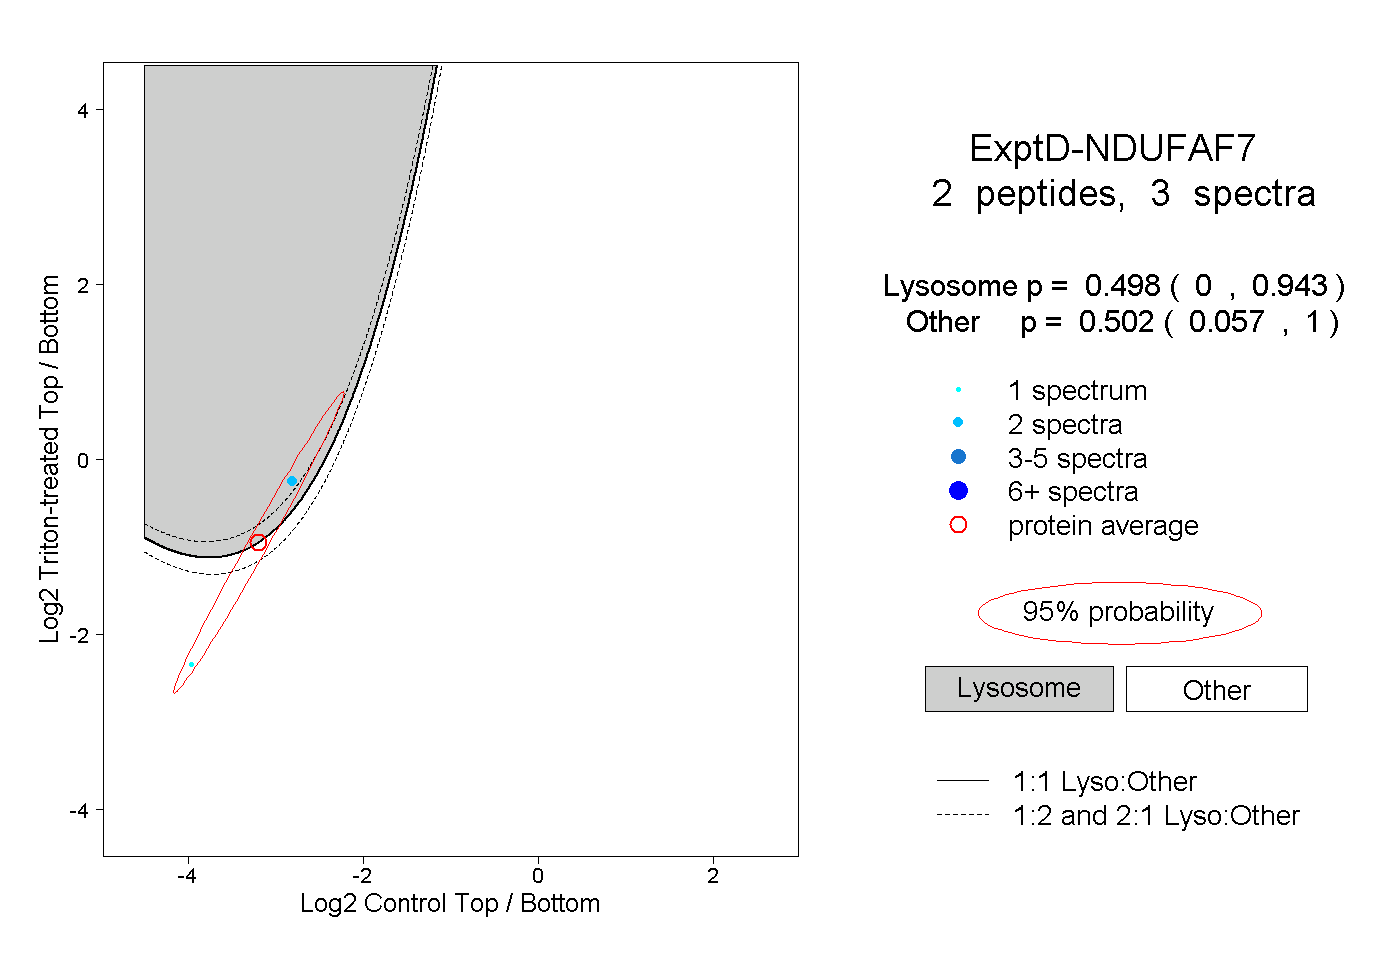
0.000 | 0.943
0.057 | 1.000