 10
10peptides
spectra

0.740 | 0.799
0.000 | 0.081
0.035 | 0.136
0.000 | 0.051
0.000 | 0.000
0.043 | 0.131
0.000 | 0.000
0.000 | 0.000
| Plot | Mito | Lyso | Perox | ER | Golgi | PM | Cytosol | Nucleus | |||||
| Expt A |
10 peptides |
16 spectra |
|
0.771 0.740 | 0.799 |
0.017 0.000 | 0.081 |
0.103 0.035 | 0.136 |
0.000 0.000 | 0.051 |
0.000 0.000 | 0.000 |
0.109 0.043 | 0.131 |
0.000 0.000 | 0.000 |
0.000 0.000 | 0.000 |
| 1 spectrum, NMGIDVR | 0.533 | 0.119 | 0.000 | 0.000 | 0.000 | 0.192 | 0.156 | 0.000 | ||
| 1 spectrum, VFSQLGSVLK | 0.298 | 0.422 | 0.000 | 0.000 | 0.138 | 0.000 | 0.141 | 0.000 | ||
| 1 spectrum, EHVEVCPDAGVVIQELSQR | 0.771 | 0.000 | 0.000 | 0.229 | 0.000 | 0.000 | 0.000 | 0.000 | ||
| 4 spectra, STAFQLVELGPGR | 0.929 | 0.063 | 0.000 | 0.000 | 0.000 | 0.000 | 0.007 | 0.000 | ||
| 1 spectrum, DVPTGYSFYLAHEFFDVLPVHK | 0.983 | 0.000 | 0.000 | 0.000 | 0.000 | 0.000 | 0.000 | 0.017 | ||
| 1 spectrum, EVLTNPAK | 0.448 | 0.132 | 0.000 | 0.161 | 0.012 | 0.246 | 0.000 | 0.000 | ||
| 2 spectra, AGDPSLQQQLLR | 0.994 | 0.000 | 0.000 | 0.000 | 0.000 | 0.000 | 0.000 | 0.006 | ||
| 1 spectrum, EVFVDIDPQSPDK | 0.402 | 0.041 | 0.358 | 0.000 | 0.000 | 0.199 | 0.000 | 0.000 | ||
| 1 spectrum, GYYVHHDMLGEK | 0.577 | 0.000 | 0.000 | 0.129 | 0.000 | 0.294 | 0.000 | 0.000 | ||
| 3 spectra, VASLGPVEQR | 0.763 | 0.146 | 0.000 | 0.000 | 0.000 | 0.000 | 0.091 | 0.000 |
| Plot | Mito | Lyso or Perox | ER | Golgi | PM | Cytosol | Nucleus | ||||||
| Expt B |
4 peptides |
7 spectra |
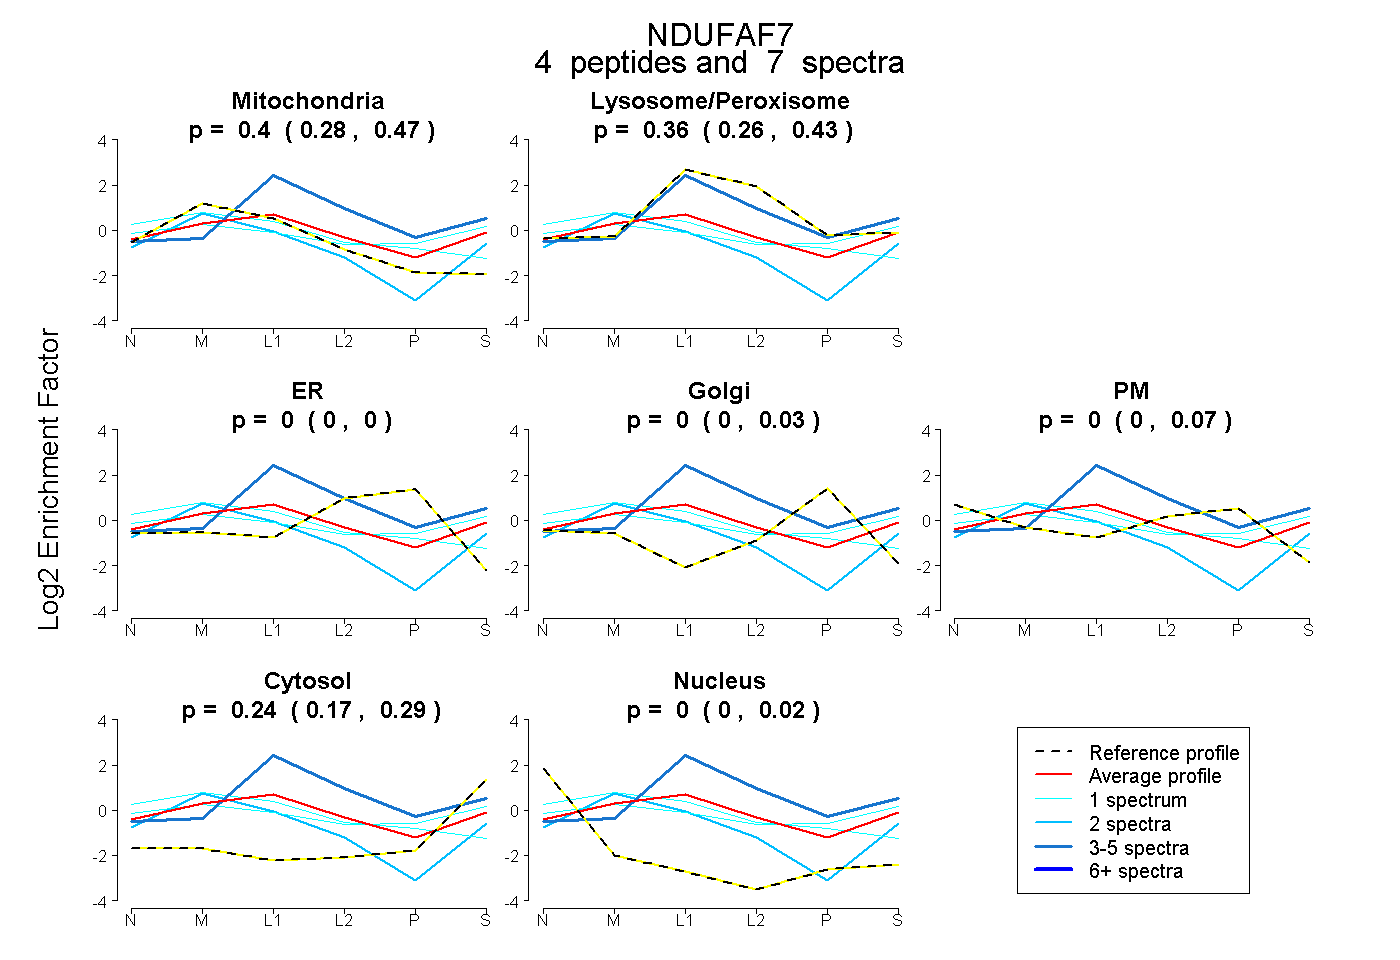 |
0.400 0.283 | 0.471 |
0.360 0.262 | 0.435 |
0.000 0.000 | 0.000 |
0.000 0.000 | 0.026 |
0.000 0.000 | 0.073 |
0.241 0.168 | 0.292 |
0.000 0.000 | 0.023 |
|||
| Plot | Lyso | Other | |||||||||||
| Expt C |
13 peptides |
31 spectra |
 |
0.000 0.000 | 0.000 |
1.000 1.000 | 1.000 |
||||||||
| Plot | Lyso | Other | |||||||||||
| Expt D |
2 peptides |
3 spectra |
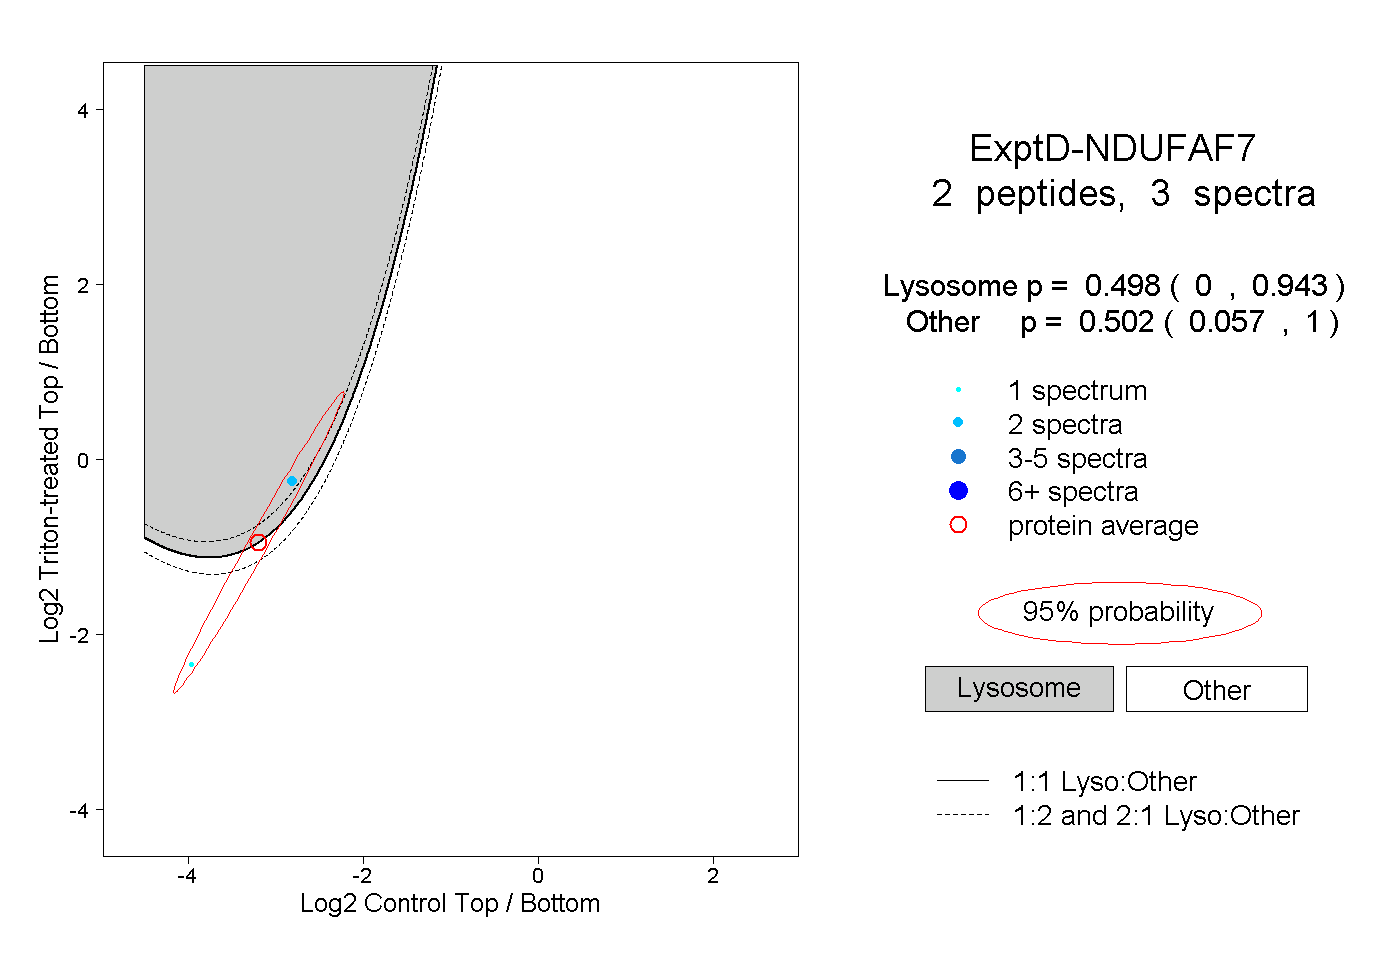 |
0.498 0.000 | 0.943 |
0.502 0.057 | 1.000 |