 5
5peptides
spectra
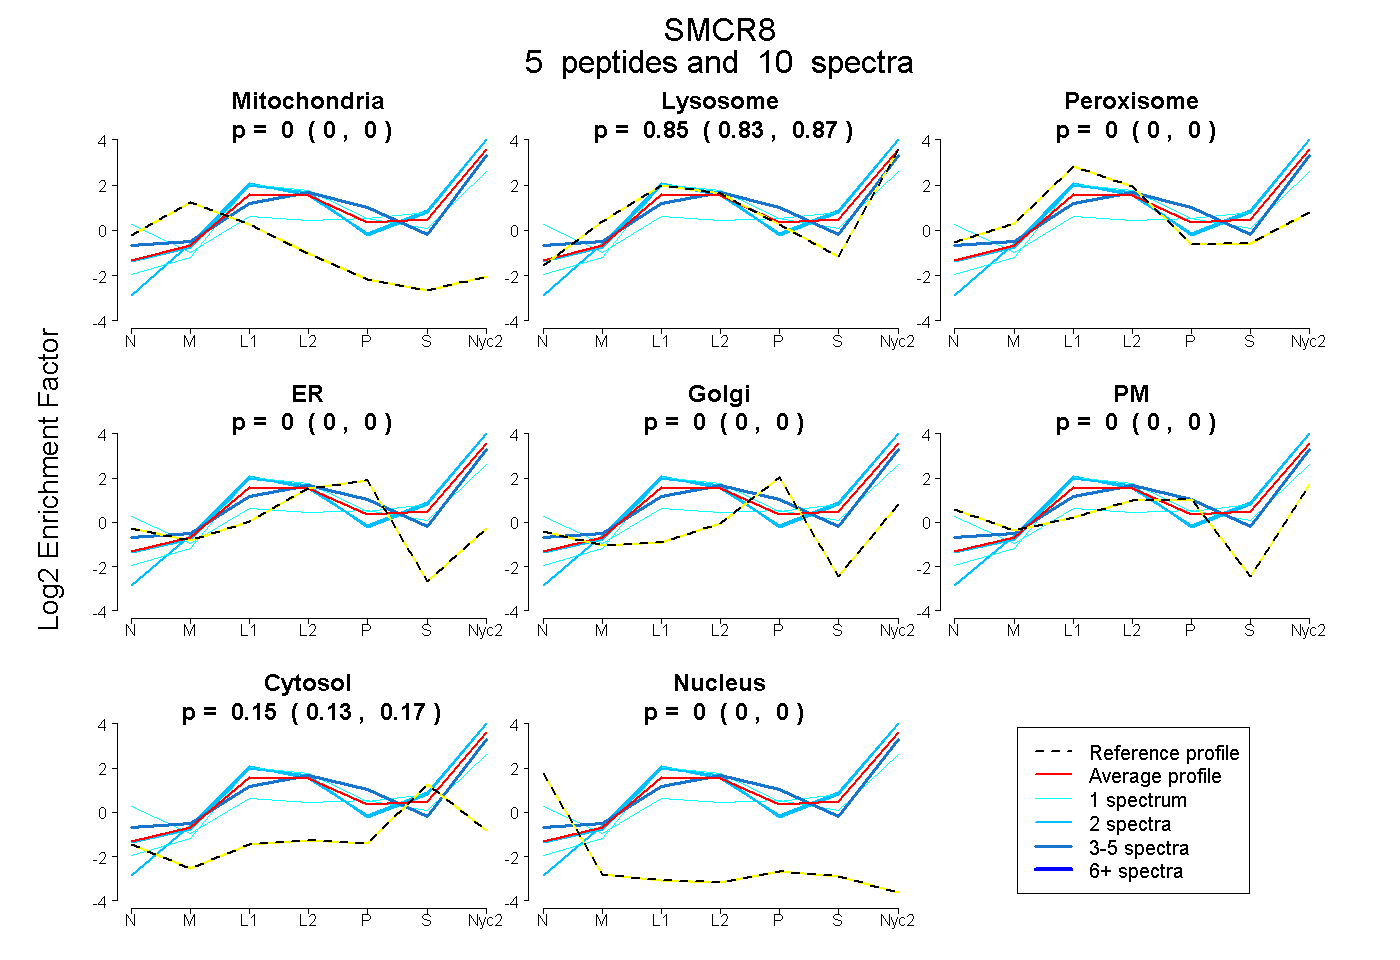
0.000 | 0.000
0.829 | 0.866
0.000 | 0.000
0.000 | 0.000
0.000 | 0.000
0.000 | 0.000
0.130 | 0.168
0.000 | 0.000
14peptides
spectra
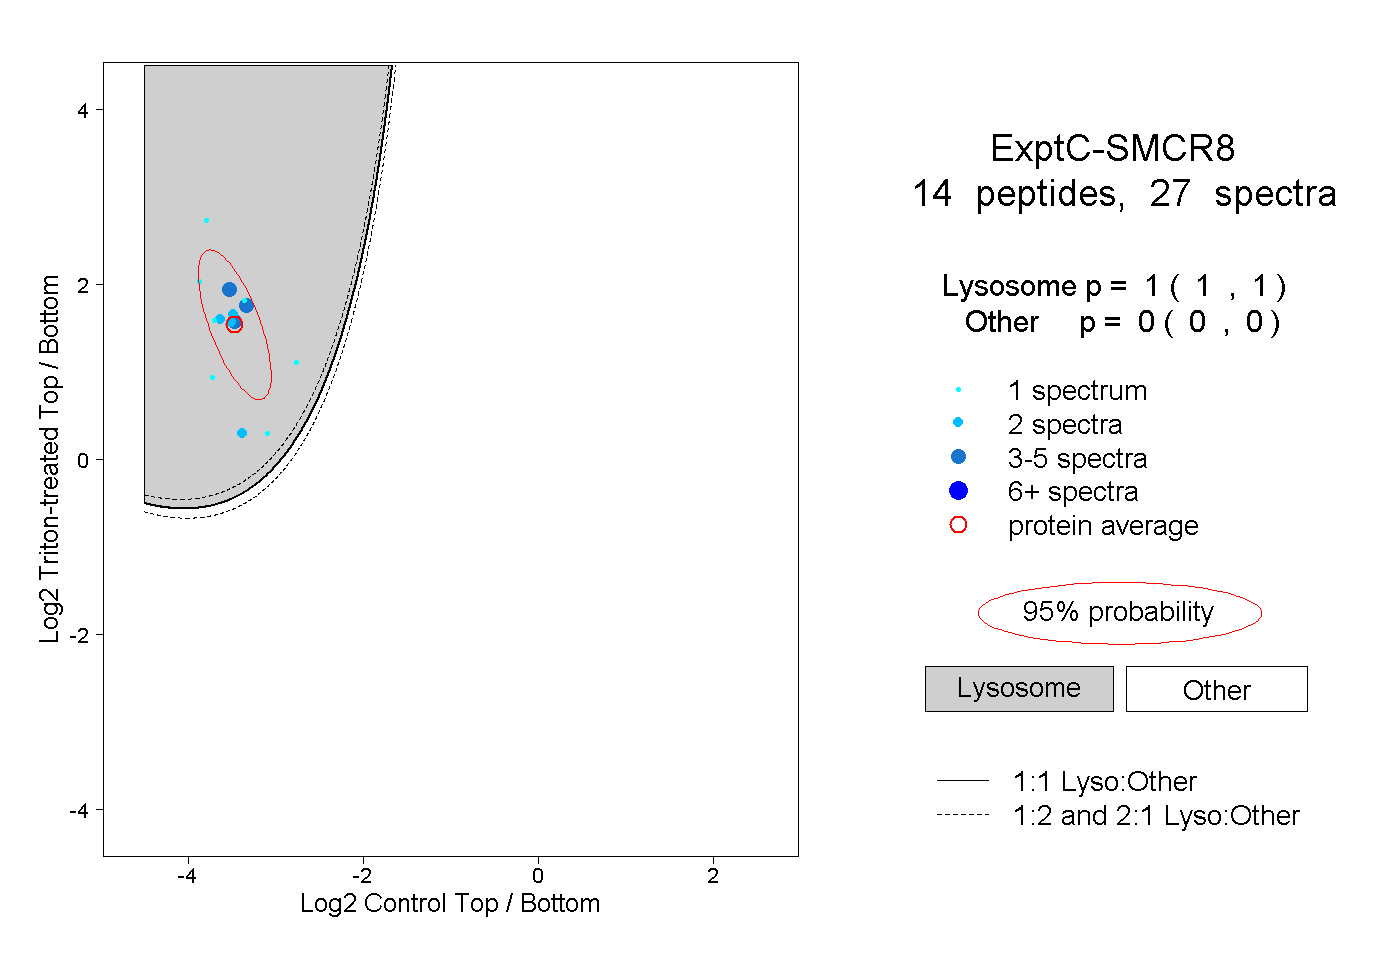
1.000 | 1.000
0.000 | 0.000
1peptide
spectrum
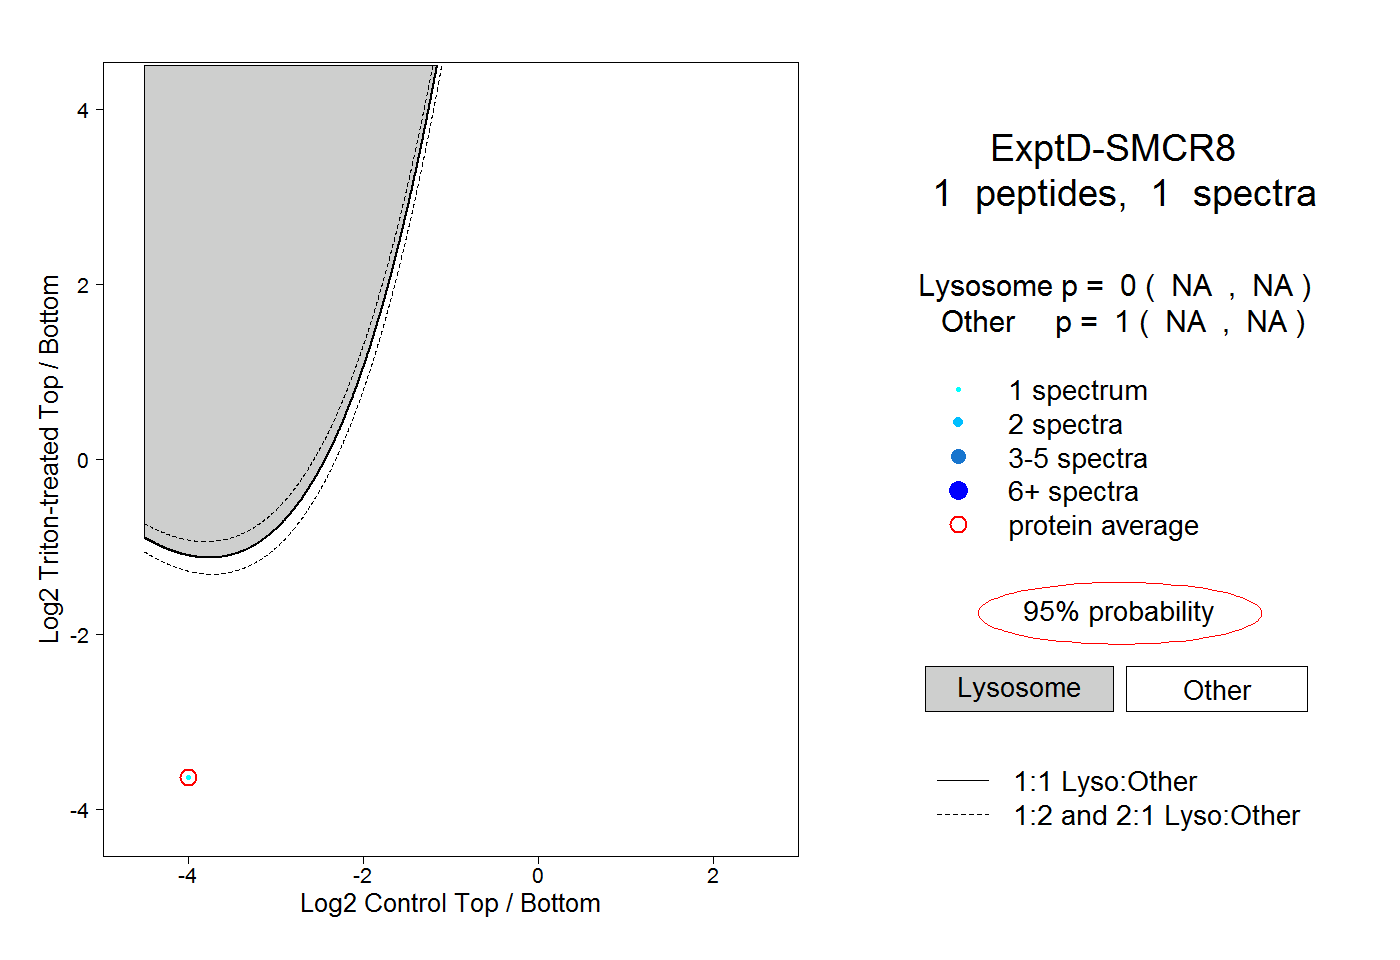
NA | NA
NA | NA