 5
5peptides
spectra
0.000 | 0.000
0.829 | 0.866
0.000 | 0.000
0.000 | 0.000
0.000 | 0.000
0.000 | 0.000
0.130 | 0.168
0.000 | 0.000
14peptides
spectra
1.000 | 1.000
0.000 | 0.000
| Plot | Mito | Lyso | Perox | ER | Golgi | PM | Cytosol | Nucleus | |||||
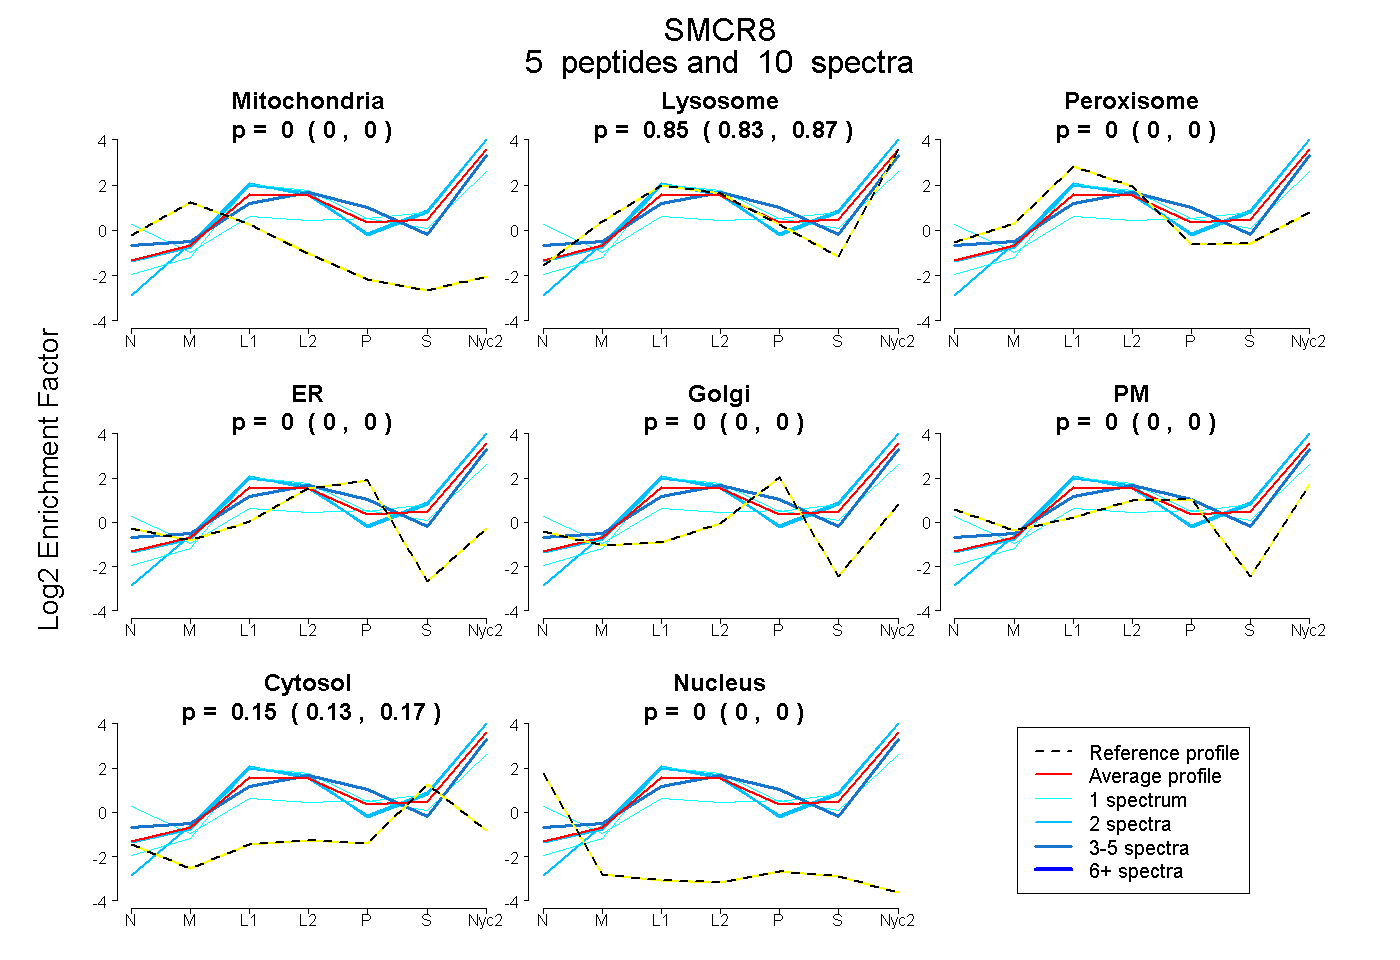
| Expt A |
5 peptides |
10 spectra |
|
0.000 0.000 | 0.000 |
0.849 0.829 | 0.866 |
0.000 0.000 | 0.000 |
0.000 0.000 | 0.000 |
0.000 0.000 | 0.000 |
0.000 0.000 | 0.000 |
0.151 0.130 | 0.168 |
0.000 0.000 | 0.000 |
||
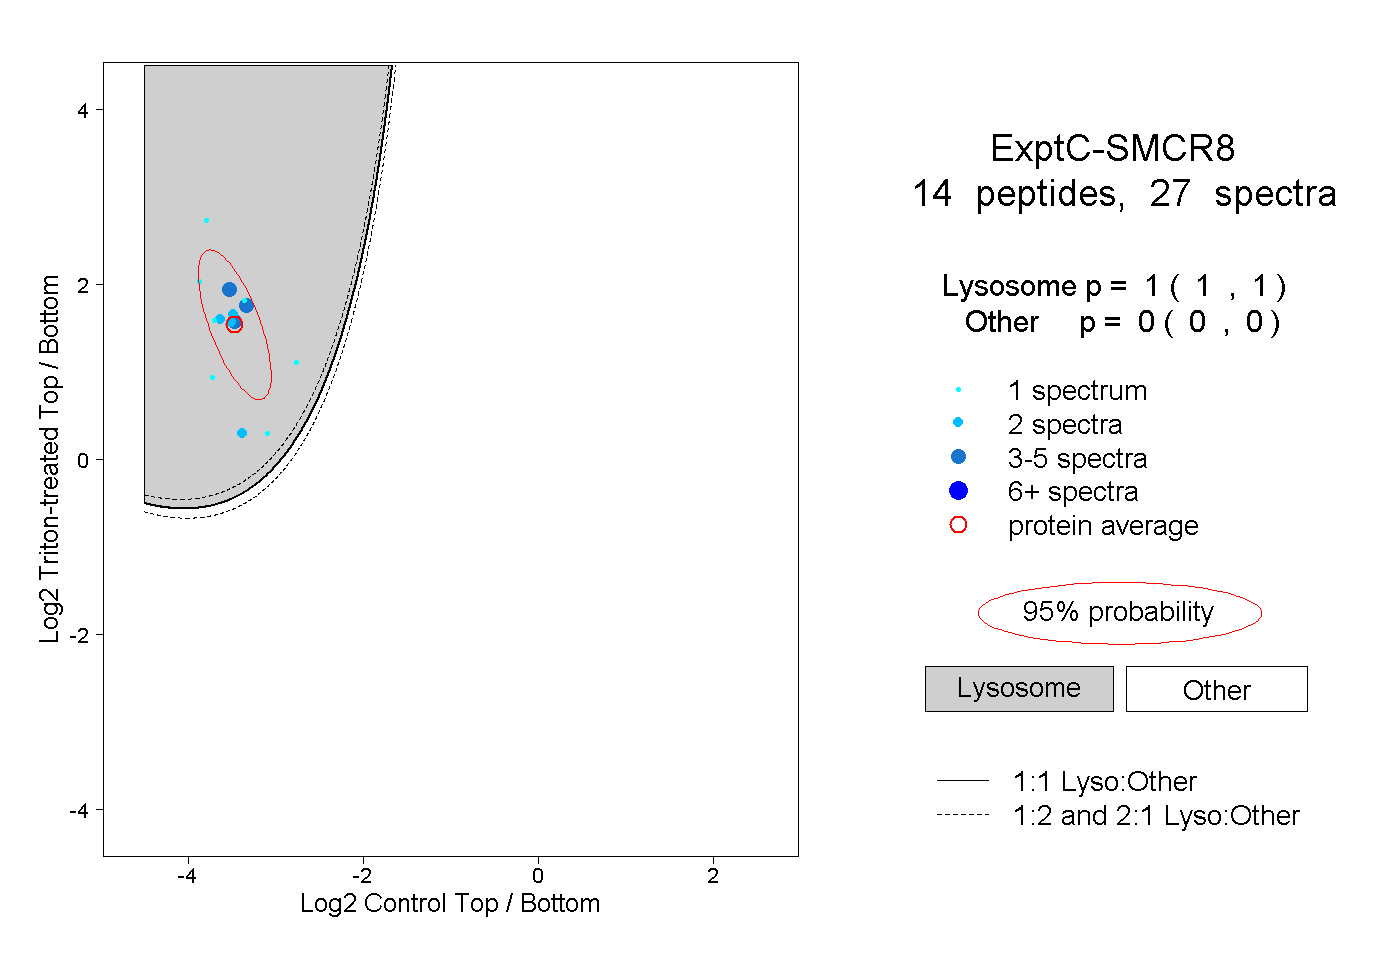
| Plot | Lyso | Other | |||||||||||
| Expt C |
14 peptides |
27 spectra |
|
1.000 1.000 | 1.000 |
0.000 0.000 | 0.000 |
| 1 spectrum, TLVVLGEDETIVR | 1.000 | 0.000 | ||||||||
| 1 spectrum, YTSILDLDSK | 1.000 | 0.000 | ||||||||
| 1 spectrum, LNLGLVNEDIR | 1.000 | 0.000 | ||||||||
| 4 spectra, DLDYTR | 1.000 | 0.000 | ||||||||
| 1 spectrum, FDYVPSFLYK | 1.000 | 0.000 | ||||||||
| 5 spectra, AGQNALK | 1.000 | 0.000 | ||||||||
| 1 spectrum, VVQYLAELLK | 1.000 | 0.000 | ||||||||
| 2 spectra, ASECLK | 0.999 | 0.001 | ||||||||
| 1 spectrum, GDLCYLLTSQIDR | 0.999 | 0.001 | ||||||||
| 2 spectra, VVLGDSK | 1.000 | 0.000 | ||||||||
| 2 spectra, ANELANVEK | 1.000 | 0.000 | ||||||||
| 1 spectrum, IPSAPPAGLSSER | 0.989 | 0.011 | ||||||||
| 3 spectra, AFAGELEK | 1.000 | 0.000 | ||||||||
| 2 spectra, LNFVEDSK | 1.000 | 0.000 |
| Plot | Lyso | Other | |||||||||||
| Expt D |
1 peptide |
1 spectrum |
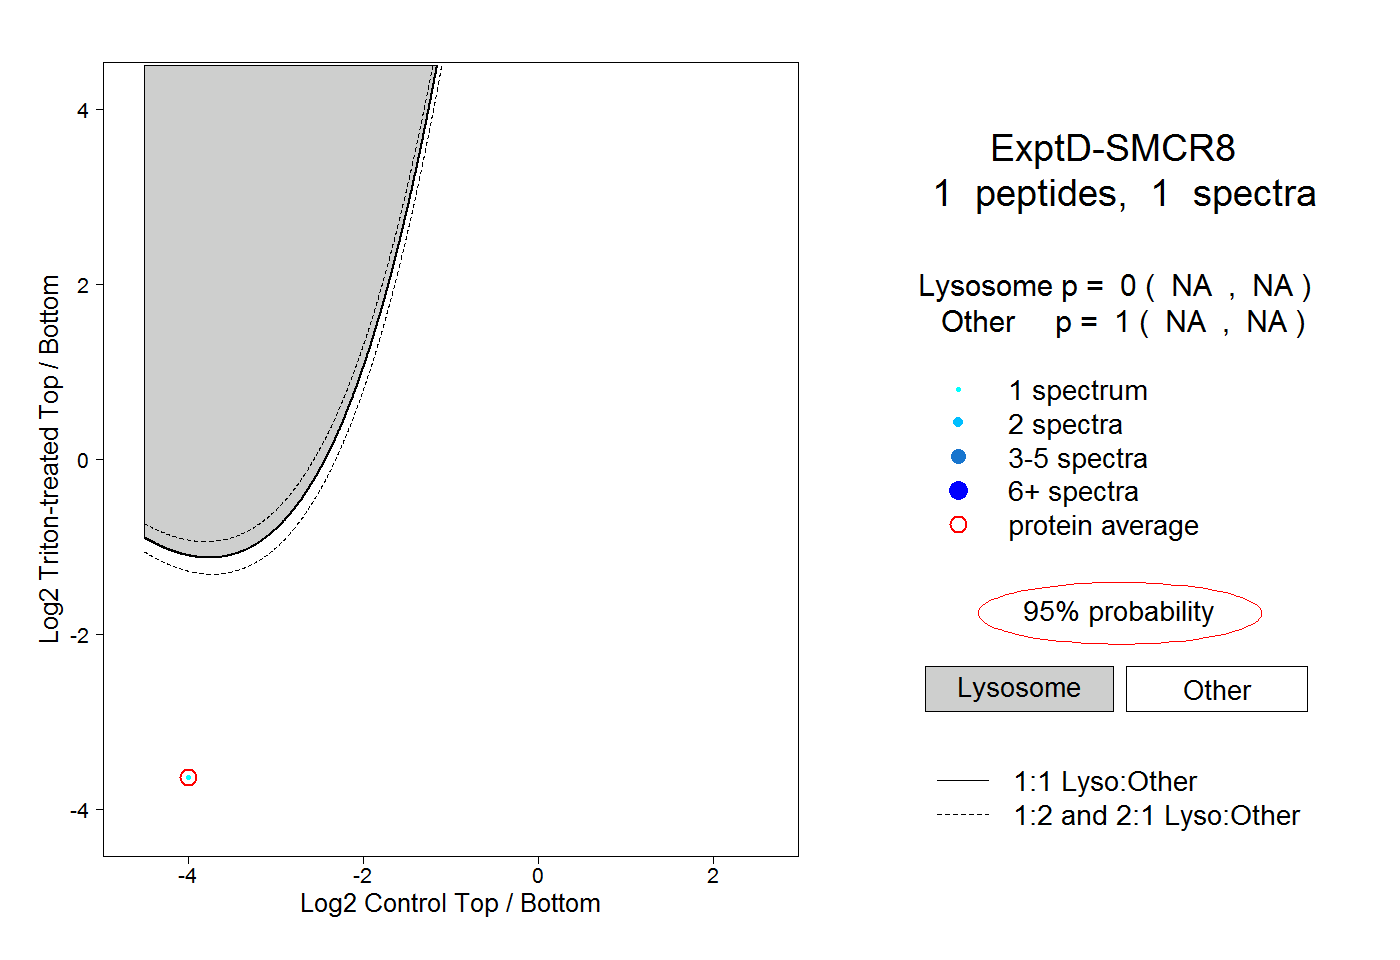 |
0.000 NA | NA |
1.000 NA | NA |