 8
8peptides
spectra
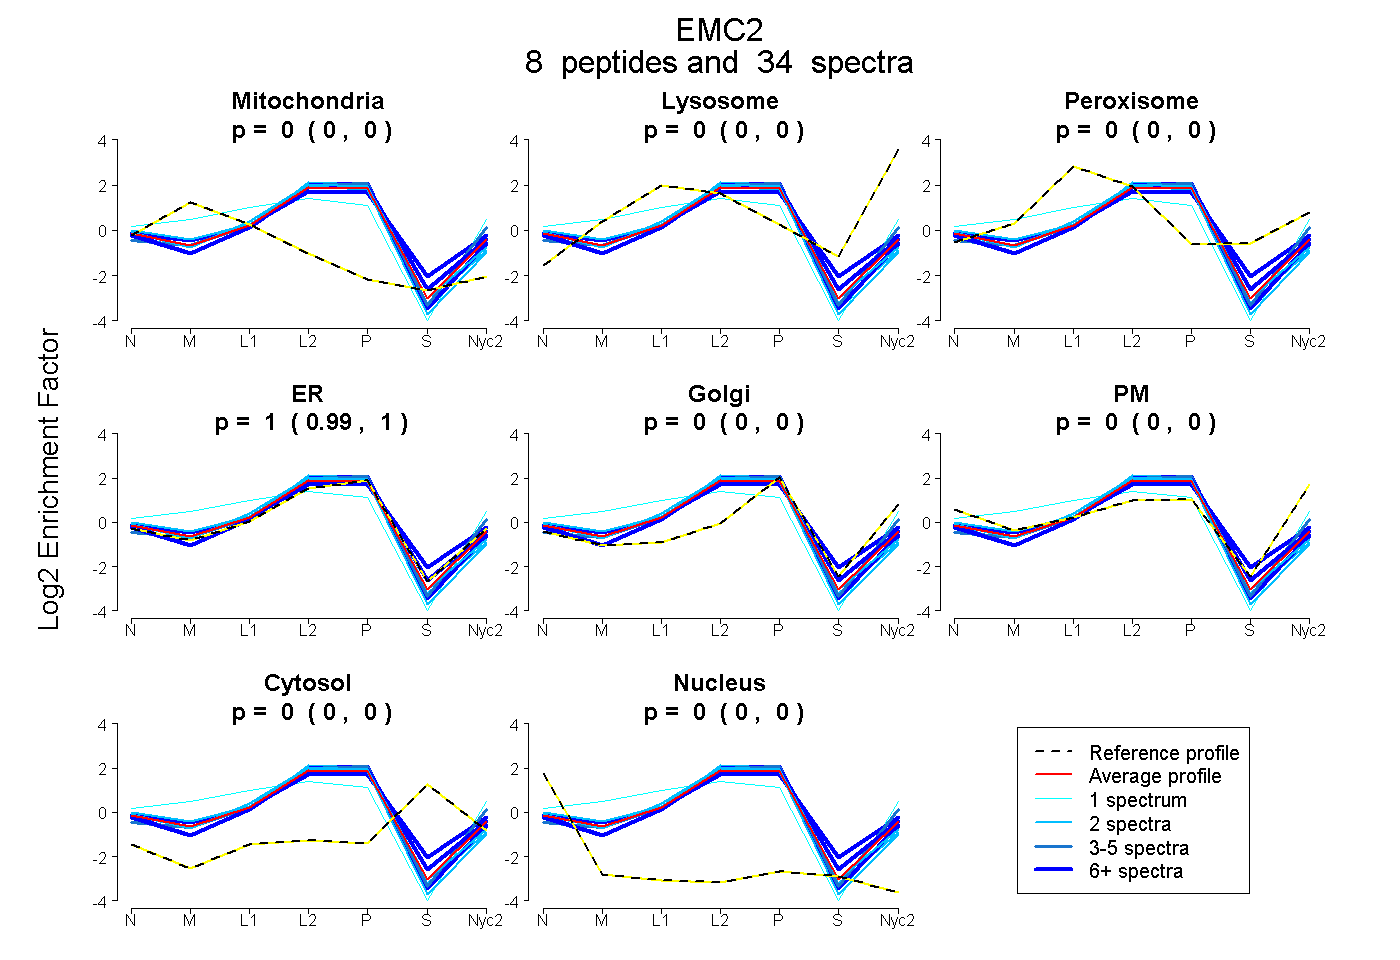
0.000 | 0.003
0.000 | 0.000
0.000 | 0.004
0.994 | 1.000
0.000 | 0.000
0.000 | 0.000
0.000 | 0.000
0.000 | 0.000
5peptides
spectra
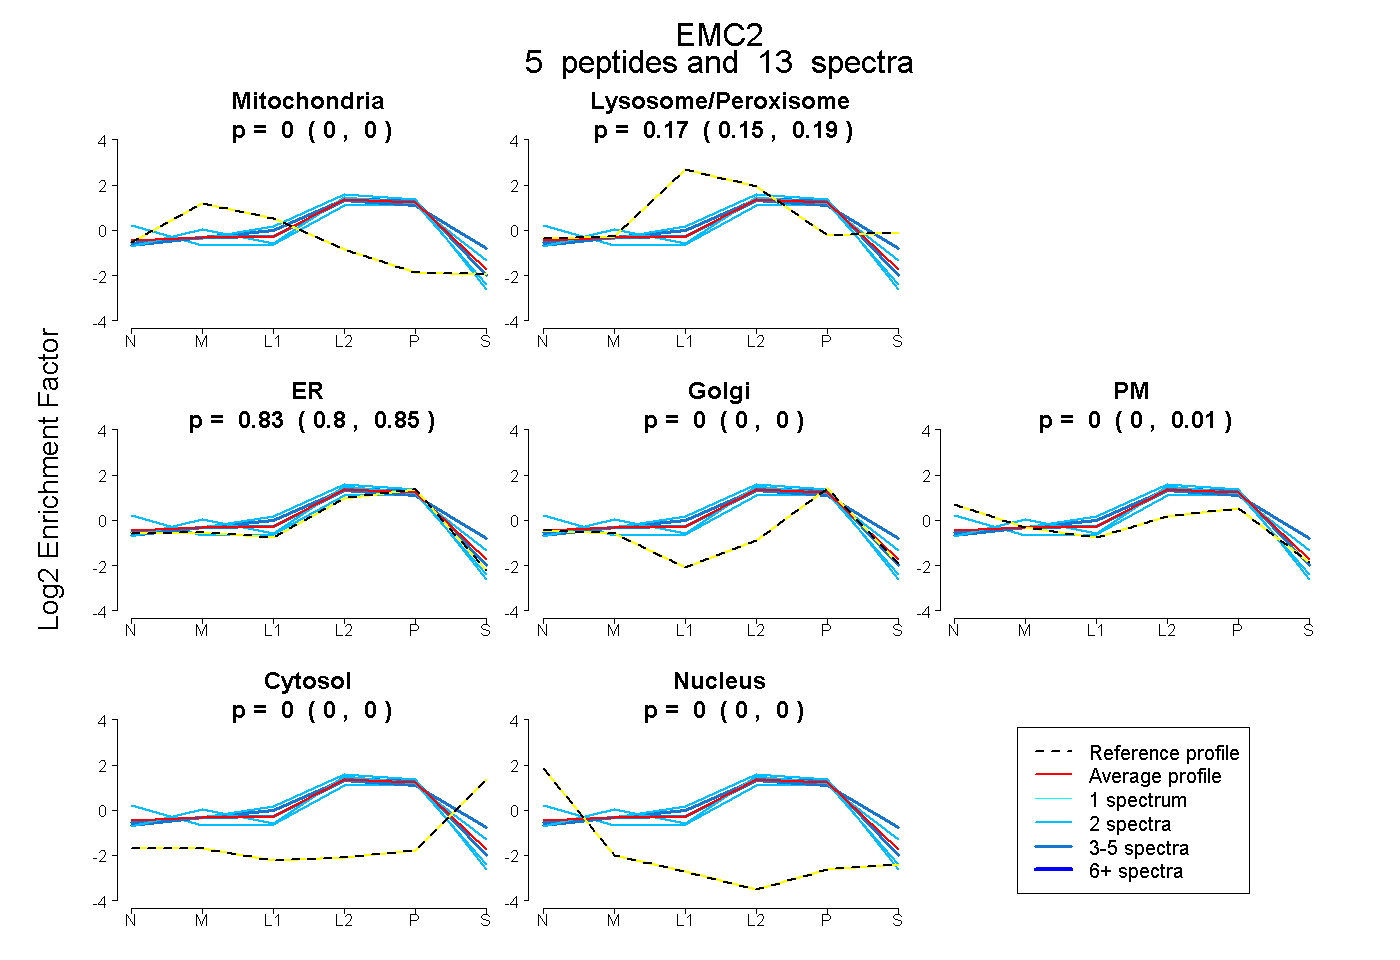
0.000 | 0.000
0.147 | 0.195
0.795 | 0.848
0.000 | 0.000
0.000 | 0.012
0.000 | 0.000
0.000 | 0.000
8peptides
spectra
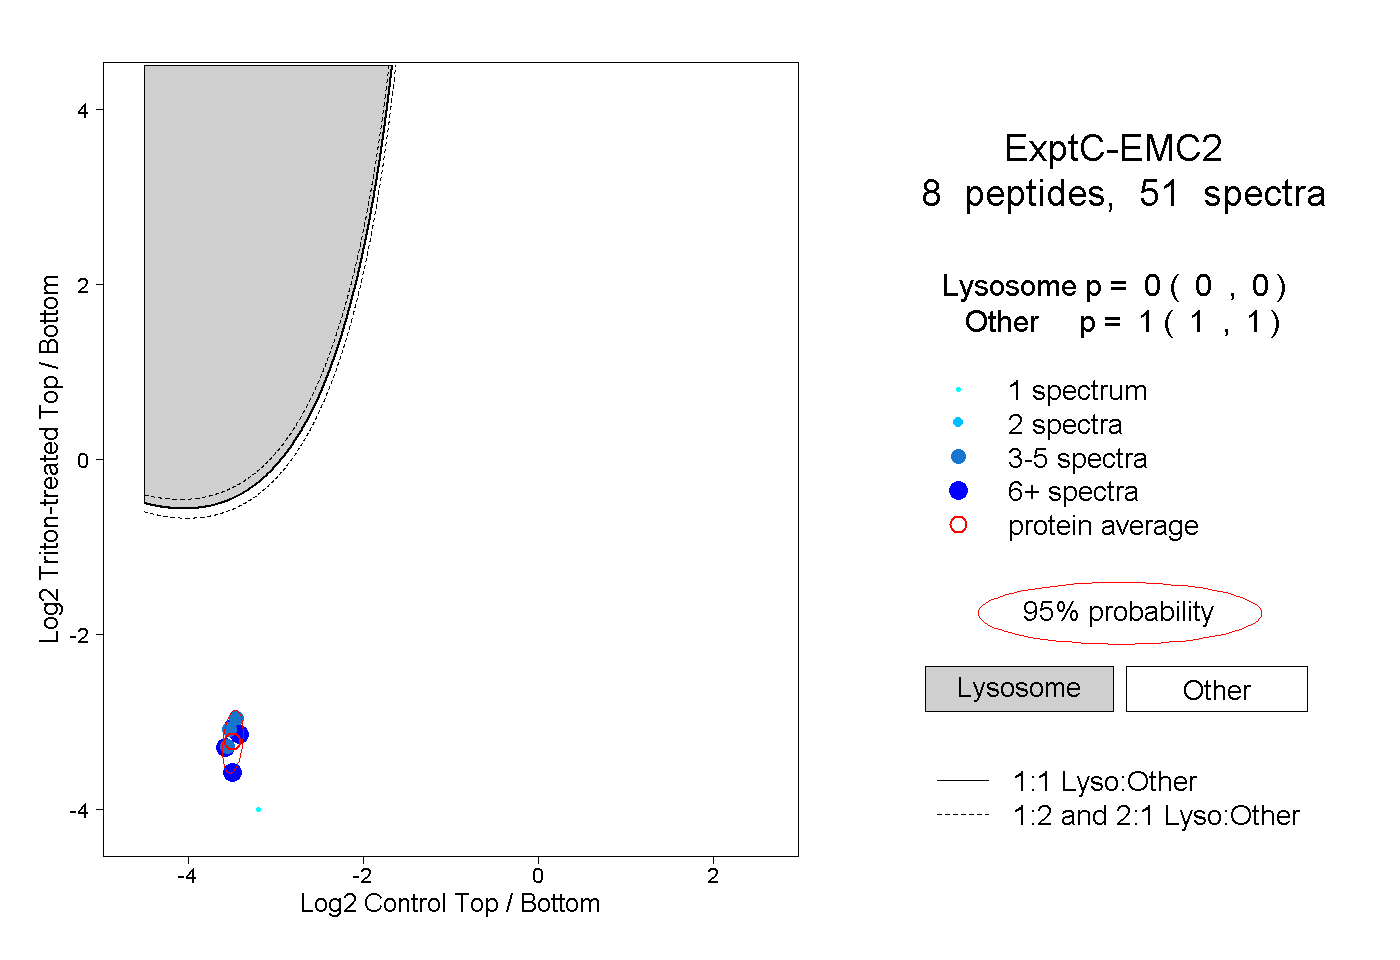
0.000 | 0.000
1.000 | 1.000
3peptides
spectra
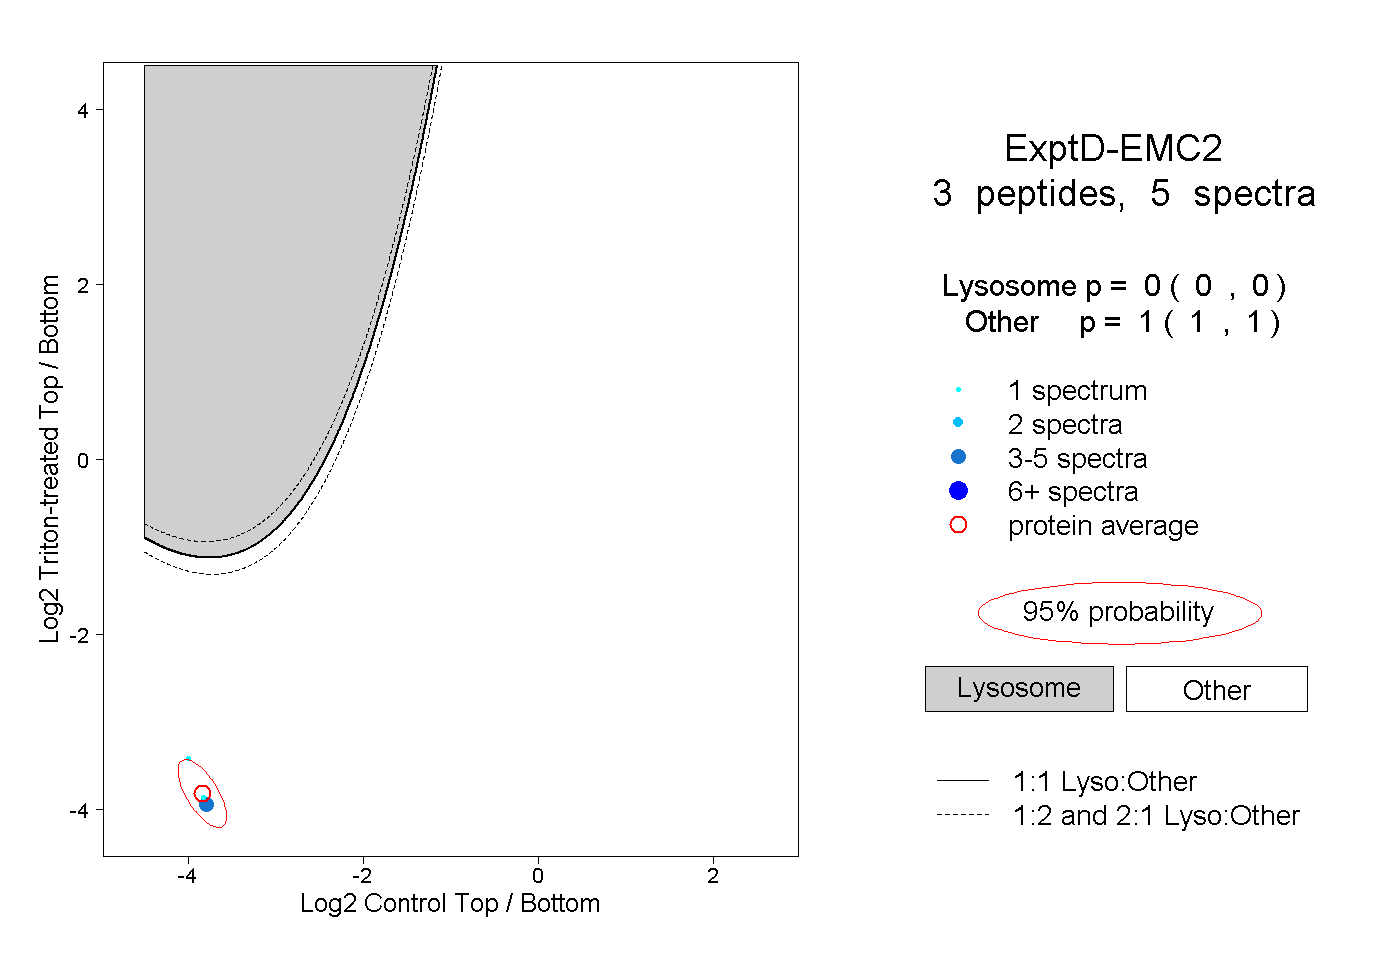
0.000 | 0.000
1.000 | 1.000